CAC 40 & Euro Stoxx 50 Outlooks Enjoy Boost From Auto Tariff Deadline
A report from Norway’s Minister of Industry suggests the United States will not pursue auto tariffs on the European Union, removing a key uncertainty facing the Euro Stoxx 50 and the CAC 40. Consequently, the two indices could look to extend their recent rallies as the newfound stability could allow tailwinds – like more accommodative monetary policy – to push European stocks higher still. With that in mind, here are the levels to watch in the week ahead.
CAC 40 PRICE CHART: MONTHLY TIME FRAME (JANUARY 2000 – NOVEMBER 2019) (CHART 1)
(Click on image to enlarge)
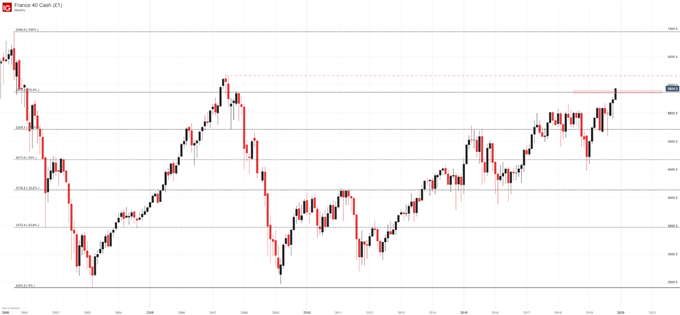
Enjoying a rally of more than 26% in the year-to-date, the CAC 40 boasts one of the better performances among the major stock indices. Now, the French equity index finds itself at the highest level since July 2007, with swing-highs from the decade prior coming into view. Thus, the index’s next area of substantial resistance may reside around 6,160.
CAC 40 PRICE CHART: DAILY TIME FRAME (OCTOBER 2017 – NOVEMBER 2019) (CHART 2)
(Click on image to enlarge)
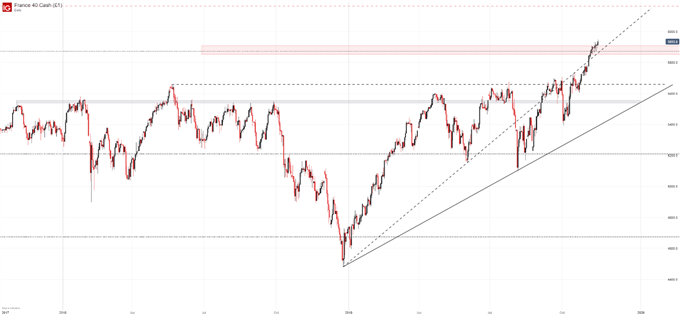
In the shorter term, the CAC could look to employ the ascending trendline from December for further gains. While the level has seen its influence fluctuate over time, recent price action suggests it still carries some weight which is an encouraging sign for the CAC 40 given its present position.
EURO STOXX 50 OUTLOOK
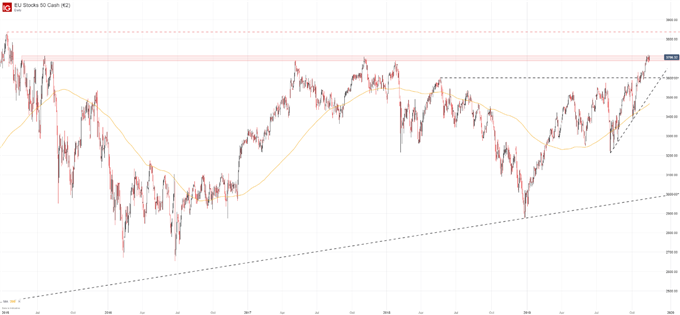
Similarly, the Euro Stoxx 50 could also receive a slight boost in the week ahead. While the EU50 has not enjoyed the same degree of gains compared to that of the CAC 40 or DAX 30, it has climbed to notable levels of its own. Closing at technical resistance around 3,700 on Friday, a bullish open next week could allow for an extended leg higher. Should it occur, resistance from April 2015 – around 3,840 – may look to stall the rally. On the other hand, the Euro Stoxx 50 will hope to employ support around 3,600 in the event bullishness subsides and bears take control.
EURO STOXX 50 PRICE CHART: DAILY TIME FRAME (APRIL 2015 – NOVEMBER 2019) (CHART 3)
(Click on image to enlarge)