
BTC/USD Technical Analysis: Is It Time To Go Long?
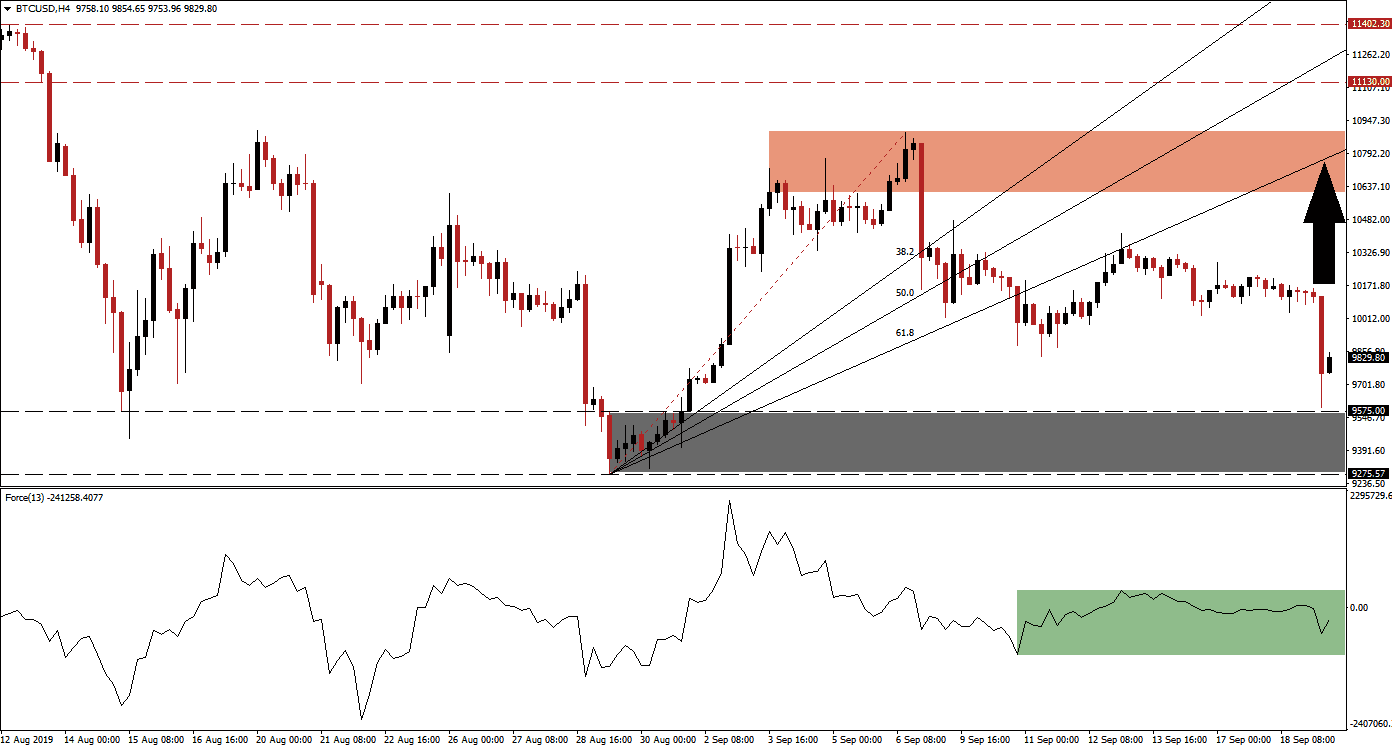
Bitcoin has been under bearish influence since it recorded its intra-day high of $13,821.00 from where a series of sell-off and price spikes followed; each creating a lower high. The advance from its most recent intra-day low of $9,275.57, the origin of the current Fibonacci Retracement Fan Sequence, extended to its intra-day high of $10,891.60 before yet another sell-off resulted in a breakdown below the entire Fibonacci Retracement Fan Sequence; this as has turned it from support into resistance. After the breakdown below its 61.8 Fibonacci Retracement Fan Support Level, price action advanced into its new resistance level before accelerating to the downside.
What is the Fibonacci Retracement Fan?
The Fibonacci Retracement Fan is a different visualization of the Fibonacci retracement sequence which outlines important support and resistance levels in technical analysis. Those levels warrant a closer look and offer entry and exit levels for trades together with other aspects of the analysis.
The Force Index, a next generation technical indicator, has been trading above-and-below its center line. As the most recent intra-day high was formed, this technical indicator started to contract which created a negative divergence preceding the breakdown in price action. As the breakdown below Fibonacci Retracement Fan Sequence materialized, the Force Index collapsed. A shallow positive divergence has now formed which is marked by the green rectangle and represents a bullish trading signal. A positive divergence forms when price action reaches new lows and the underlying technical indicator advances.
What is the Force Index?
The force index is considered a next generation technical indicator. As the name suggests, it measures the force behind a move. In other words, forex traders will get a better idea behind the strength of bullish or bearish pressures which are driving price action. The indicator consist of three components (directional change of the price, the degree of the change and the trading volume). This creates an oscillator which in conjunction with other aspects of technical analysis provides a good indicator for potential changes in the direction of price action. It subtracts the previous day closing price from today’s closing price and multiplies it by the volume. Strong moves are supported by volume and create the most accurate trading signals.
The most recent drop in price action created an intra-day low of $9,592.19, located just above the top range of its support zone between $9,275.57 and $9,575.00 marked by the grey rectangle. The advance in the Force Index should now be closely monitored together with the $9,832.50 level which marks the intra-day low following the breakdown below its 61.8 Fibonacci Retracement Fan Support Level. The subsequent advance which was followed by the most recent drop in BTC/USD confirmed the change of the Fibonacci Retracement Fan Sequence from support to resistance.
What is a Support Zone?
A support zone is a price range where bearish momentum is receding and bullish momentum is advancing. They can identify areas where price action has a chance to reverse to the upside and a support zone offers a more reliable technical snapshot than a single price point such as an intra-day low.
A successful move above the $9,832.50 level with a confirmation of the Force Index through a move above 0, could trigger a short-covering rally which will take BTC/USD back into its ascending 61.8 Fibonacci Retracement Fan Retracement Level. This level is currently passing though its resistance zone which is located between $10,608.40 and $10,891.60, marked by the red rectangle in the chart. More upside is possible since the resistance level is ascending and the strength of the Force Index will provide further details once the expected short-covering rally unfolds.
What is a Short-Covering Rally?
A short-covering rally refers to traders covering short positions which is done by buying the underlying asset which was previously borrowed for the trade from a third-party. When a short order is placed, traders borrow the asset from a third party and sell it in the market. Once price action declines it is bought back at a lower price and returned to the third-party which creates a short-covering rally, a counter-trend move.
BTC/USD Technical Trading Set-Up - Short-Covering Rally
- Long Entry @ 9,850.00
- Take Profit @ 10,850.00
- Stop Loss @ 9,500.00
- Upside Potential: 100,000 pips
- Downside Risk: 35,000 pips
- Risk/Reward Ratio: 2.86
A renewed push lower in the Force Index and violation of the longer term uptrend could invite fresh net sell orders in BTC/USD and result in a breakdown. A negative fundamental development would be required as a catalyst in order to push this cryptocurrency below its strong support zone. Any short term move into the $9,275.57 and $9,575.00 support zone should be viewed as a solid buying opportunity as long as the uptrend in the Force Index remains intact; a collapse would increase the breakdown pressure for BTC/USD. A breakdown may be limited to its intra-day low of $8,871.29 which represents the low of a previous price gap.
What is a Breakdown?
A breakdown is the opposite of a breakout and occurs when price action moves below a support or resistance zone. A breakdown below a resistance zone could suggest a short-term move such as profit taking by forex traders or a long-term move such as a trend reversal from bullish to bearish. A breakdown below a support zone indicates a strong bearish trend and the extension of the downtrend.
BTC/USD Technical Trading Set-Up - Limited Breakdown Scenario
- Short Entry @ 9,145.00
- Take Profit @ 8,875.00
- Stop Loss @ 9,275.00
- Downside Potential: 27,000 pips
- Upside Risk: 13,000 pips
- Risk/Reward Ratio: 2.08
(Click on image to enlarge)
Disclosure: DailyForex will not be held liable for any loss or damage resulting from reliance on the information contained within this website including market news, analysis, trading signals ...
more

