
BSE Sensex 30 Index: Multiple Time Frame Geometric Analysis
- Short-Term/Daily: Uptrend in place since September 28, 2017. Market bounced off support last Friday.
- Intermediate-Term/Weekly: Uptrend progressing since February 29, 2016. Market dropping following hit of circular resistance. Possible change of trend.
- Long-Term/Monthly: Uptrend since March 2009. Possible failed breakout of a large geometric channel, with a potential drop to channel support coming, which would produce an intermediate-term correction at the least.
SHORT-TERM/DAILY:
Last Friday, December 1st saw the Sensex dropping and touching circular support as seen in this next chart. It missed the specific price support level of the circle by only 2.50 points:
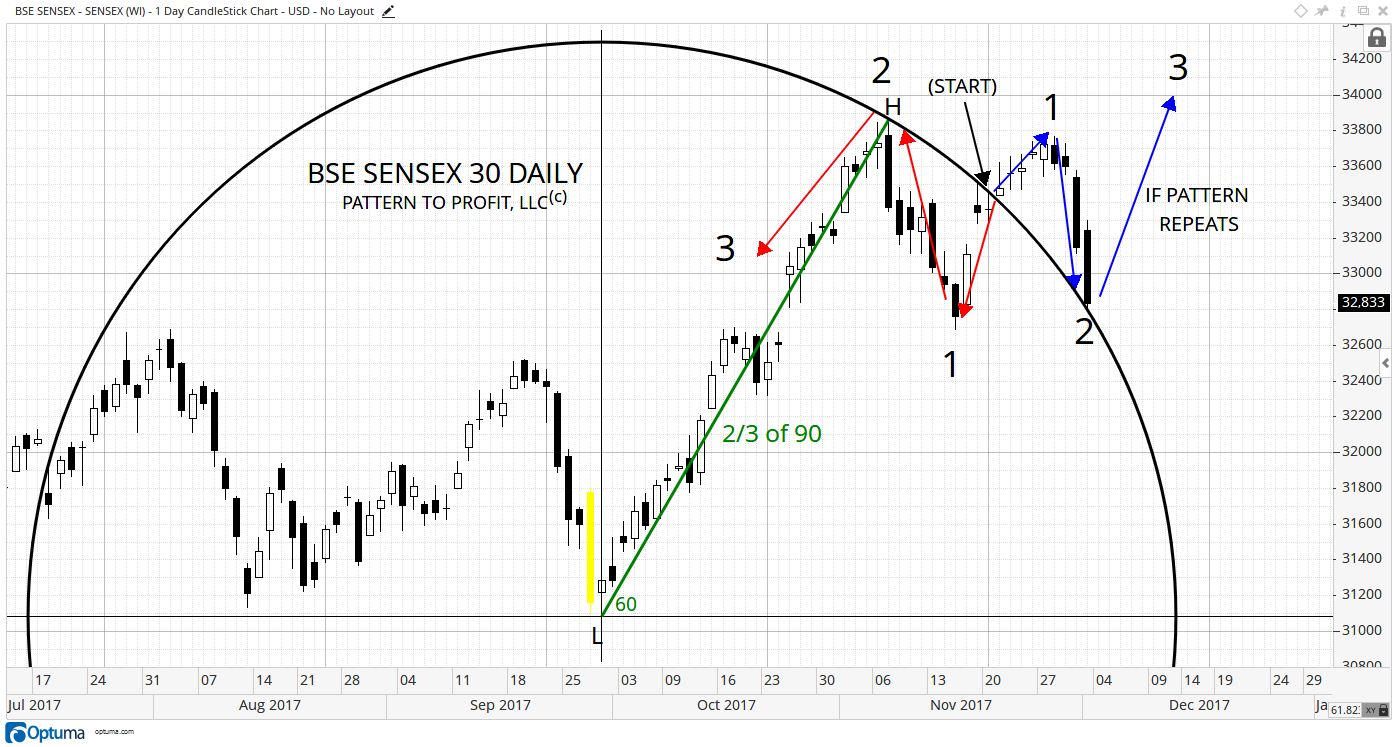
The circular resistance (now support) shown is a geometric expression of the preceding uptrend (marked L-H) and set to 60o (green) or 2/3 of 90o. Its resulting circle provides regression for the market, as outlined by the sets of blue and red arrows.
If the backwards pattern (red) repeats forward (blue) with the third move (up), a significant uptrend may ensue, with higher highs. If the pattern does not repeat, the market may drop back inside the circle, proving the circular support ineffective and a short-term change in trend would then be in effect, signaled by a lower low (from Friday).
However, in assessing the potential of a reversal off of circular support for this Monday, December 4th the next chart identifies the current market as related to the preceding two lows:
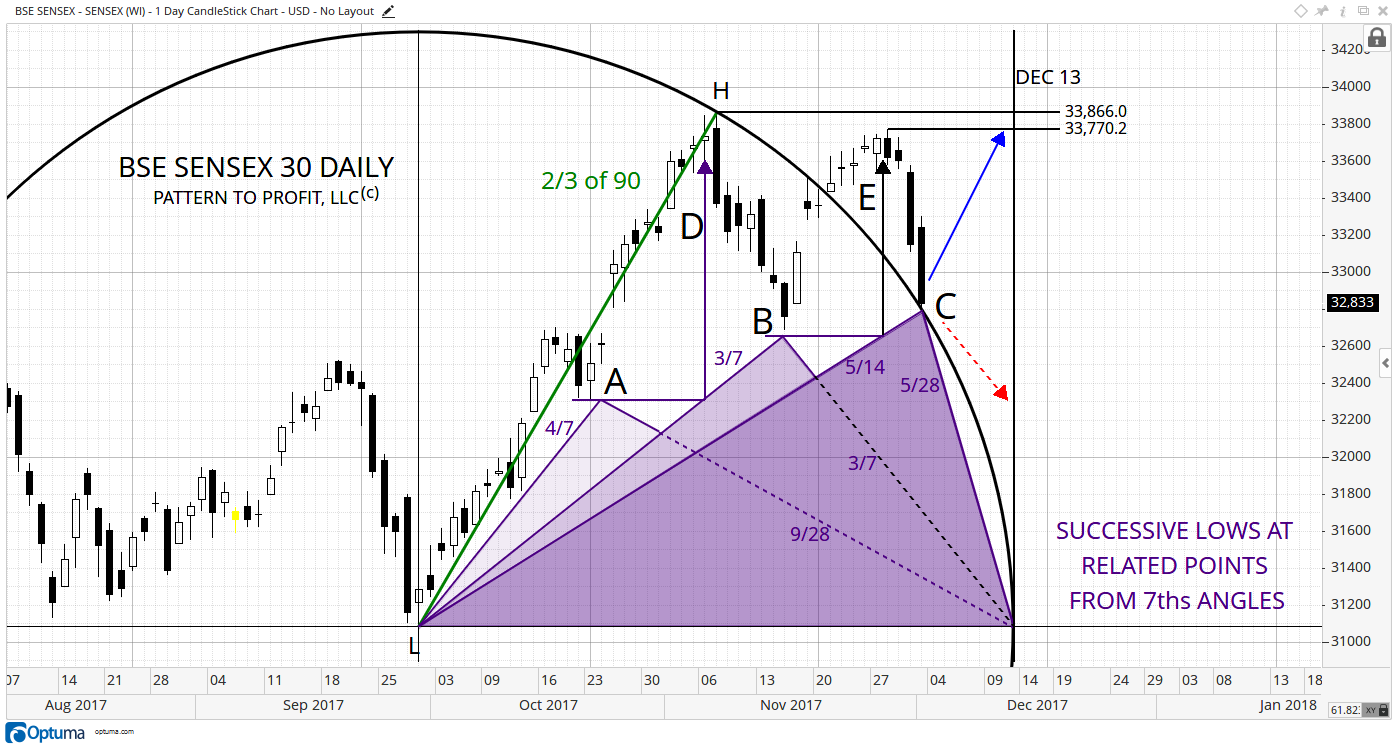
By combining 7ths angles from both the center (L) and the right ‘corner’ of the circle, triangles are formed whose apexes pinpoint the lows at A and B, and a potential low currently at C.
(The top areas at D and E are related as well, as the price levels of A and B square (or make a 90o angle from) the adjacent triangles giving effective timing points (vertical purple). This activity lends strength to the analysis.
If the market does reverse this Monday off circular support, reaching previous high prices of 33,770.2 and possibly 33,866 is anticipated. The timing point of December 13, 2017 (circle’s right edge) is given as a distinct possibility for arrival to either of those levels.
Again, the market does not have to respect the circular support, which would present the possibility of a change in short-term (and possibly intermediate) trend. In that event, the vector low of 31,082 is a realistic downward target.
INTERMEDIATE-TERM/WEEKLY:
Last week (beginning November 27) saw the Sensex drop almost 3%. The following weekly chart offers a geometric explanation as to why it did not drop so drastically from its all-time high just a few weeks before, on November 7:
This vector concentric circle analysis (derived from the preceding large downtrend (H-L) being set to 45o) shows last week’s high of 33,770 just nudge circular resistance from the 15/8 circle at C.
This 15/8 circle can also be expressed as 1 3/8, which when inverted to the internal 8/13 circle (black dashed) identifies the preceding high at B (29,091.6, from the top of the circle), as well as an earlier secondary low at A. This activity is not to be taken lightly, as the geometry states that the current market drop from resistance most likely will produce a move of similar magnitude as its two predecessors.
The target of 29,091.6 on the week of April 16, 2018, is given, and appears to be a proportionate correction in the overall uptrend.
LONG-TERM/MONTHLY:
Using the large downtrend from January 2008 at 21,207 to March 2009 at 8,047, set to 18o (1/5 of 90o when measured from the vertical axis), the resulting circle identifies the first subsequent correction at A. This demonstrates that the geometric setup from the trend set to 1/5 is on track.
When a 1/5 angle is placed on the vector high (H), the subsequent major high at B is identified, as well as revealing the current market as a potential false breakout of resistance at E:
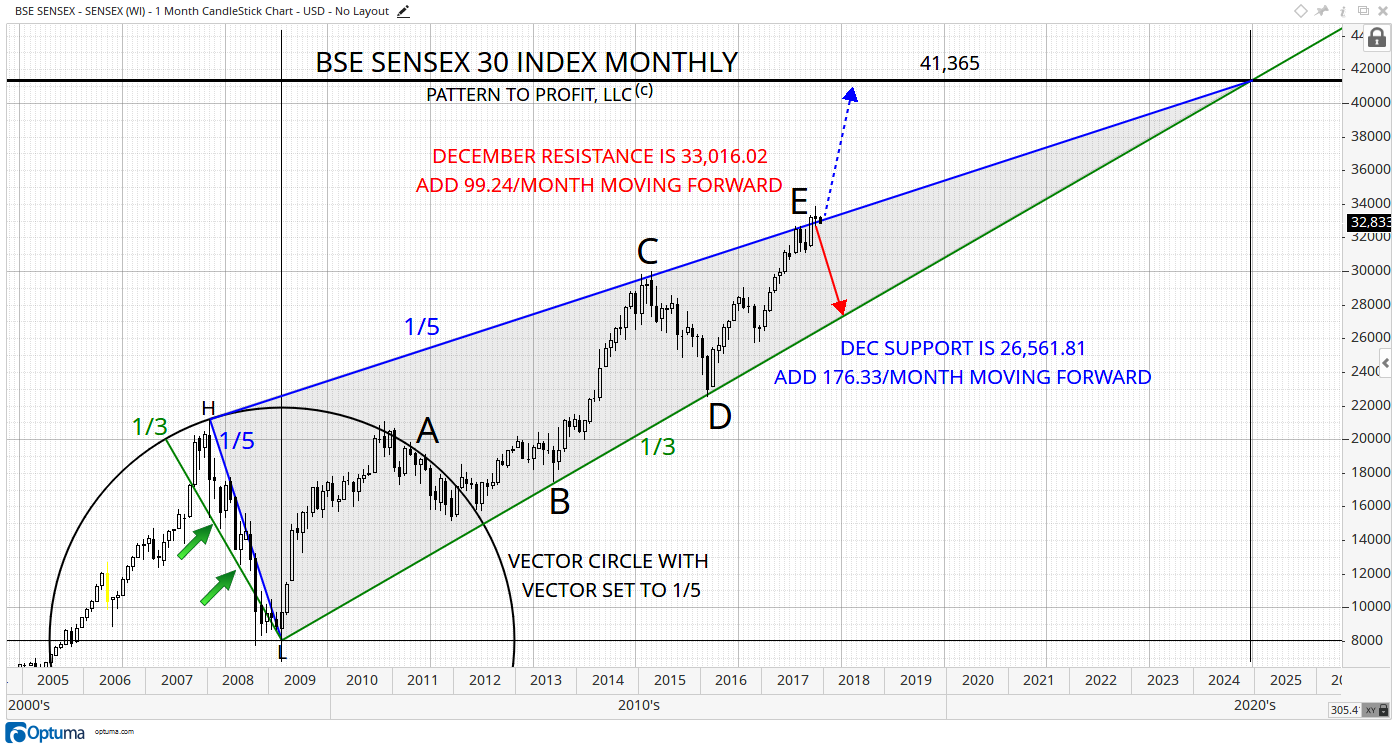
December’s value of the 1/5 resistance angle is 33,016.02. If the market closes above this level to close out the month and year, a continued bull market is in order. The higher price area of 41,365 is then the next major resistance level.
However, if the market continues to drop back into this ascending wedge shape (shaded), then support is given at the 1/3 angle. The current month’s support is 26,561.81. By adding 176.33/month starting in January, future monthly support is obtained.
Although some of this information is available by simply drawing some basic trendlines (connecting points H-C, and L-B), trendlines would not provide a framework for advanced analysis. (Note the lows prior to the vector low (L) on the other 1/3 angle (green arrows) providing retrospective confirmation.)
In other words, although the low at D and the false breakout appearance at E can come from trendlines, they would not provide the following relationship for the lows, with a price/time target for a potential low:
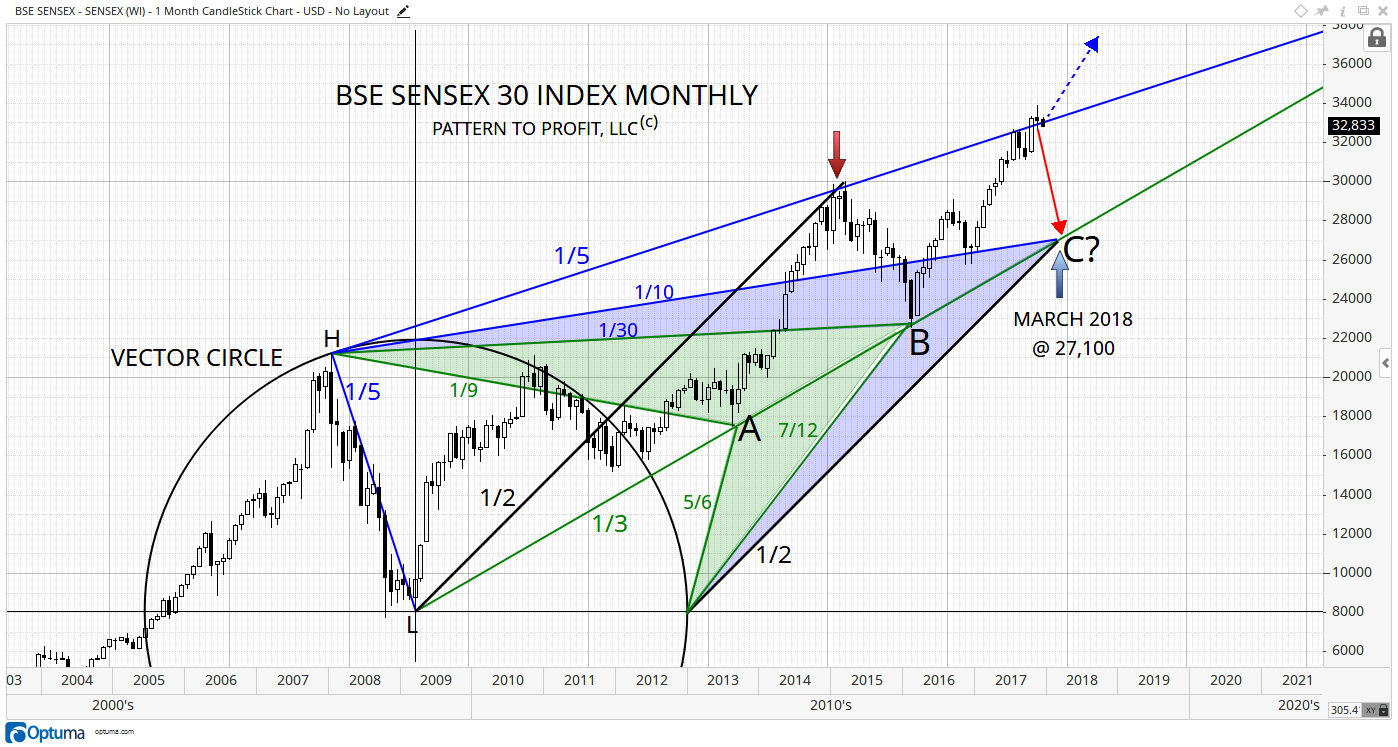
When a 45o angle (1/2) is placed from the center low (L), it identifies the previous high (red arrow). When duplicated from the circle’s right edge, it lands on the support angle exactly where a 1/10 angle from the vector high (H) strikes it. This is significant, as the preceding highs at A and B display this angular agreement as well (green and blue triangles). This indicates that a swift drop to 27,100 in March 2018 is possible, provided of course that December closes underneath resistance of 36,016.62
Disclaimer: /we have no positions in any securities mentioned, and no plans to initiate any positions within the next 72 hours.


