Wednesday, July 1, 2020 5:36 AM EDT
GBP/USD TESTING RESISTANCE
Any potential upside for GBP/USD (FXB) is again being held back by resistance from a downward sloping trendline marking the upper boundary of a channel in place on the charts for the past three weeks. Reinforcing that resistance is the 50-day moving average, which at 1.2404 also stands just above the current price.
GBP/USD PRICE CHART, ONE-HOUR TIMEFRAME (JUNE 3 – JULY 1, 2020)
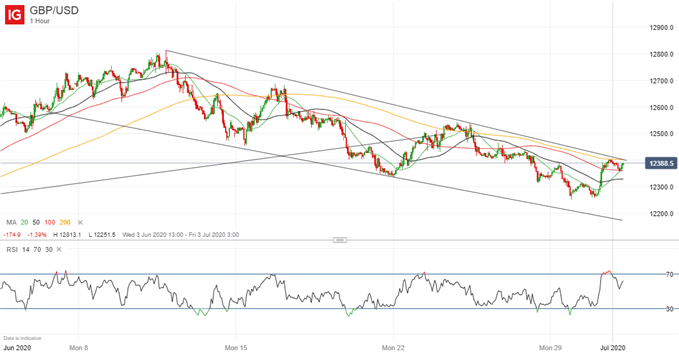
Chart by IG (You can click on it for a larger image)
From a fundamental perspective, markets globally are weighing up some positive economic data against the surge in coronavirus infections in the US. This session, the June purchasing managers’ indexes for the manufacturing sectors in China and Australia both came in above expectations – and above the 50 mark that separates expansion from contraction – and there was also news of a surprise increase in German retail sales in May.
However, the UK’s Nationwide house price index for May showed its first fall since 2012 and there was more news of job cuts in the UK, this time from the Airbus aerospace company (EADSY). The protests in Hong Kong against the new security law there are also denting sentiment generally.
As for the FTSE 100 index of the major London-listed stocks, that was little changed in early trading Wednesday, held back like other equity indexes by news that the US has recorded its biggest single-day spike in infections since the COVID-19 pandemic began.
Disclaimer: DailyFX, the free news and research website from IG, is one of the world's leading sources for news and analysis on the ...
more
Disclaimer: DailyFX, the free news and research website from IG, is one of the world's leading sources for news and analysis on the currency, commodity and index trading community. With nine internationally-based analysts publishing over 30 articles and producing 5 video news updates daily, DailyFX offers in-depth coverage of price action, predictions of likely market moves, and exhaustive interpretations of salient economic and political developments. DailyFX is also home to one of the most powerful economic calendars available on the web, complete with advanced sorting capabilities, detailed descriptions of upcoming events on the economic docket, and projections of how economic report data will impact the markets. Combined with the free charts and live rate updates featured on DailyFX, the DailyFX economic calendar is an invaluable resource for traders who heavily rely on the news for their trading strategies. Additionally, DailyFX serves as a portal to one of the most vibrant online discussion forums in the forex trading community. Avoiding market noise and the irrelevant personal commentary that plague many forex blogs and forums, the DailyFX Forum has established a reputation as being a place where real traders go to talk about serious trading.
Any opinions, news, research, analyses, prices, or other information contained on dailyfx.com are provided as general market commentary and does not constitute investment advice. Dailyfx will not accept liability for any loss or damage, including without limitation to, any loss of profit, which may arise directly or indirectly from use of or reliance on such information.
less
How did you like this article? Let us know so we can better customize your reading experience.


