
Here are the latest charts and statistics for the Commitment of Traders (COT) data published by the Commodities Futures Trading Commission (CFTC).
The latest COT data is updated through Tuesday March 22nd and shows a quick view of how large traders (for-profit speculators and commercial entities) were positioned in the futures markets.
Highlighting the COT bonds data is the pullback in the 10-Year Bond bearish bets this week. The speculative position in the 10-Year Bond has risen for two straight weeks following three straight weeks of declines (or rising bearish bets). The last two week’s rise has shaved off over 113,886 contracts from the total bearish position and brings the current standing to the least bearish level of the past five weeks at a total of -263,834 contracts. The 10-Year has been under pressure like most all bond markets as the Federal Reserve has started raising interest rates with an outlook of more rate increases to come. The 10-Year yield (as bond prices fall, yields rise) has been sharping surging to the upside with the close this week right around the 2.50 percent level, marking its highest yield since May of 2019. The speculator’s 10-Year bond pullback this week will likely be short-lived and it will be interesting to see if this latest bout of inflation, growth and central bank rate rises will be enough to finally break the multi-decade bull market for bonds.
The bond markets with higher speculator bets were the 10-Year Bond (57,163 contracts), Fed Funds (91,899 contracts) and the 5-Year Bond (50,964 contracts).
The bond markets with lower speculator bets were the 2-Year Bond (-27,015 contracts), Eurodollar (-128,245 contracts), Ultra 10-Year (-21,571 contracts), Long US Bond (-11,687 contracts) and the Ultra US Bond (-32,279 contracts).
Data Snapshot of Bond Market Traders | Columns Legend
| Eurodollar | 10,832,338 | 41 | -2,656,722 | 0 | 3,074,395 | 100 | -417,673 | 13 |
| 10-Year | 3,807,553 | 51 | -263,834 | 31 | 464,339 | 80 | -200,505 | 32 |
| 5-Year | 3,774,450 | 36 | -296,338 | 31 | 544,383 | 80 | -248,045 | 13 |
| 2-Year | 2,297,315 | 20 | -47,448 | 73 | 126,538 | 48 | -79,090 | 10 |
| FedFunds | 2,132,176 | 81 | -13,382 | 38 | 29,682 | 63 | -16,300 | 18 |
| Long T-Bond | 1,128,229 | 36 | 32,551 | 95 | -5,394 | 18 | -27,157 | 31 |
3-Month Eurodollars Futures:
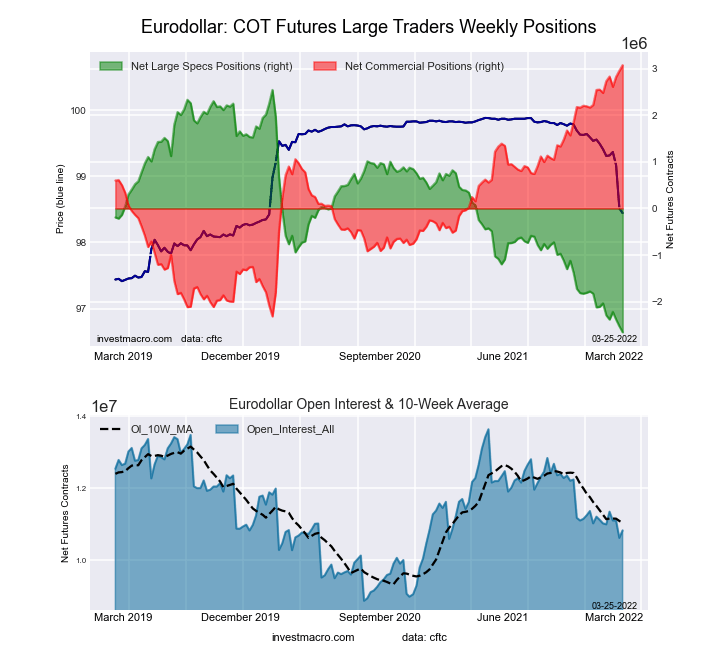
The 3-Month Eurodollars large speculator standing this week equaled a net position of -2,656,722 contracts in the data reported through Tuesday. This was a weekly lowering of -128,245 contracts from the previous week which had a total of -2,528,477 net contracts.
This week’s current strength score (the trader positioning range over the past three years, measured from 0 to 100) shows the speculators are currently Bearish-Extreme with a score of 0.0 percent. The commercials are Bullish-Extreme with a score of 100.0 percent and the small traders (not shown in chart) are Bearish-Extreme with a score of 12.5 percent.
| 3-Month Eurodollars Statistics | SPECULATORS | COMMERCIALS | SMALL TRADERS |
| – Percent of Open Interest Longs: | 4.2 | 75.7 | 3.6 |
| – Percent of Open Interest Shorts: | 28.7 | 47.4 | 7.4 |
| – Net Position: | -2,656,722 | 3,074,395 | -417,673 |
| – Gross Longs: | 451,791 | 8,204,977 | 389,102 |
| – Gross Shorts: | 3,108,513 | 5,130,582 | 806,775 |
| – Long to Short Ratio: | 0.1 to 1 | 1.6 to 1 | 0.5 to 1 |
| NET POSITION TREND: | |||
| – Strength Index Score (3 Year Range Pct): | 0.0 | 100.0 | 12.5 |
| – Strength Index Reading (3 Year Range): | Bearish-Extreme | Bullish-Extreme | Bearish-Extreme |
| NET POSITION MOVEMENT INDEX: | |||
| – 6-Week Change in Strength Index: | -11.9 | 11.0 | 5.8 |
30-Day Federal Funds Futures:
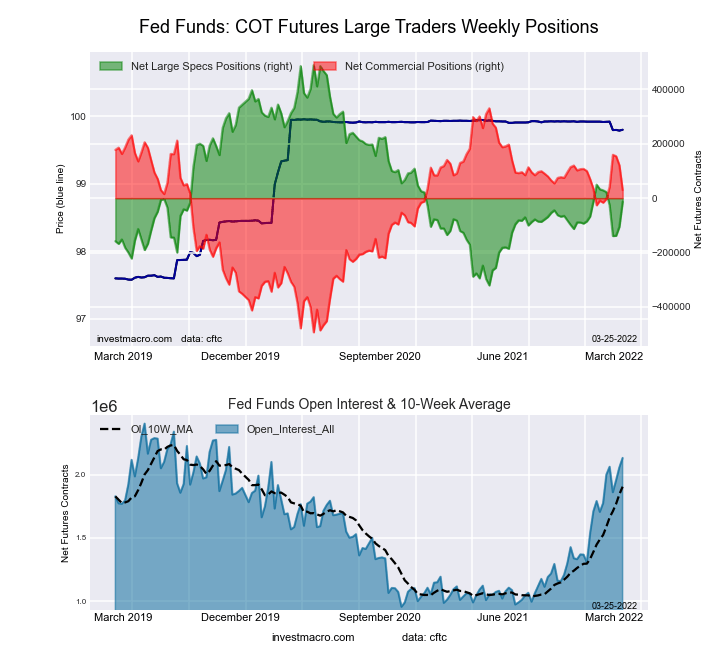
The 30-Day Federal Funds large speculator standing this week equaled a net position of -13,382 contracts in the data reported through Tuesday. This was a weekly advance of 91,899 contracts from the previous week which had a total of -105,281 net contracts.
This week’s current strength score (the trader positioning range over the past three years, measured from 0 to 100) shows the speculators are currently Bearish with a score of 38.0 percent. The commercials are Bullish with a score of 63.5 percent and the small traders (not shown in chart) are Bearish-Extreme with a score of 18.3 percent.
| 30-Day Federal Funds Statistics | SPECULATORS | COMMERCIALS | SMALL TRADERS |
| – Percent of Open Interest Longs: | 7.1 | 77.0 | 1.8 |
| – Percent of Open Interest Shorts: | 7.7 | 75.6 | 2.6 |
| – Net Position: | -13,382 | 29,682 | -16,300 |
| – Gross Longs: | 150,828 | 1,640,744 | 38,998 |
| – Gross Shorts: | 164,210 | 1,611,062 | 55,298 |
| – Long to Short Ratio: | 0.9 to 1 | 1.0 to 1 | 0.7 to 1 |
| NET POSITION TREND: | |||
| – Strength Index Score (3 Year Range Pct): | 38.0 | 63.5 | 18.3 |
| – Strength Index Reading (3 Year Range): | Bearish | Bullish | Bearish-Extreme |
| NET POSITION MOVEMENT INDEX: | |||
| – 6-Week Change in Strength Index: | -5.2 | 5.6 | -10.5 |
2-Year Treasury Note Futures:
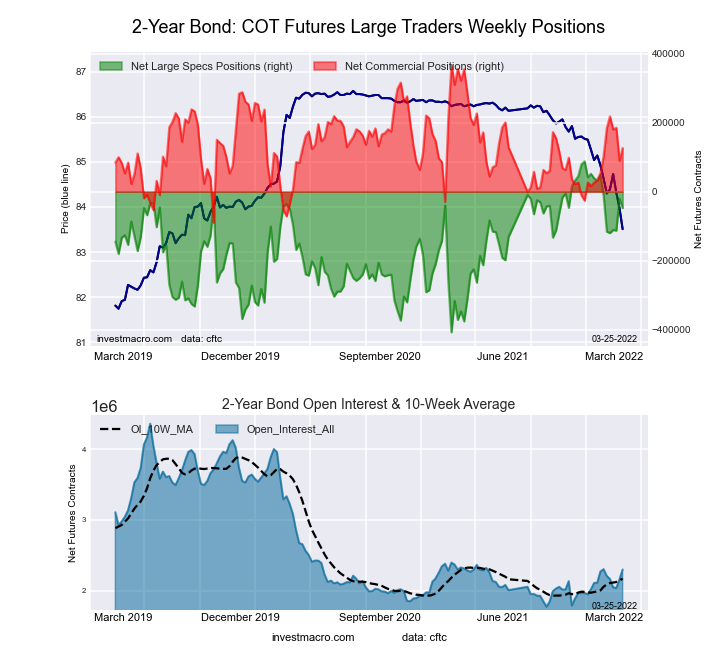
The 2-Year Treasury Note large speculator standing this week equaled a net position of -47,448 contracts in the data reported through Tuesday. This was a weekly fall of -27,015 contracts from the previous week which had a total of -20,433 net contracts.
This week’s current strength score (the trader positioning range over the past three years, measured from 0 to 100) shows the speculators are currently Bullish with a score of 72.7 percent. The commercials are Bearish with a score of 47.5 percent and the small traders (not shown in chart) are Bearish-Extreme with a score of 9.9 percent.
| 2-Year Treasury Note Statistics | SPECULATORS | COMMERCIALS | SMALL TRADERS |
| – Percent of Open Interest Longs: | 15.9 | 73.9 | 6.1 |
| – Percent of Open Interest Shorts: | 18.0 | 68.4 | 9.6 |
| – Net Position: | -47,448 | 126,538 | -79,090 |
| – Gross Longs: | 365,795 | 1,697,892 | 140,374 |
| – Gross Shorts: | 413,243 | 1,571,354 | 219,464 |
| – Long to Short Ratio: | 0.9 to 1 | 1.1 to 1 | 0.6 to 1 |
| NET POSITION TREND: | |||
| – Strength Index Score (3 Year Range Pct): | 72.7 | 47.5 | 9.9 |
| – Strength Index Reading (3 Year Range): | Bullish | Bearish | Bearish-Extreme |
| NET POSITION MOVEMENT INDEX: | |||
| – 6-Week Change in Strength Index: | -7.3 | 5.2 | 5.5 |
5-Year Treasury Note Futures:
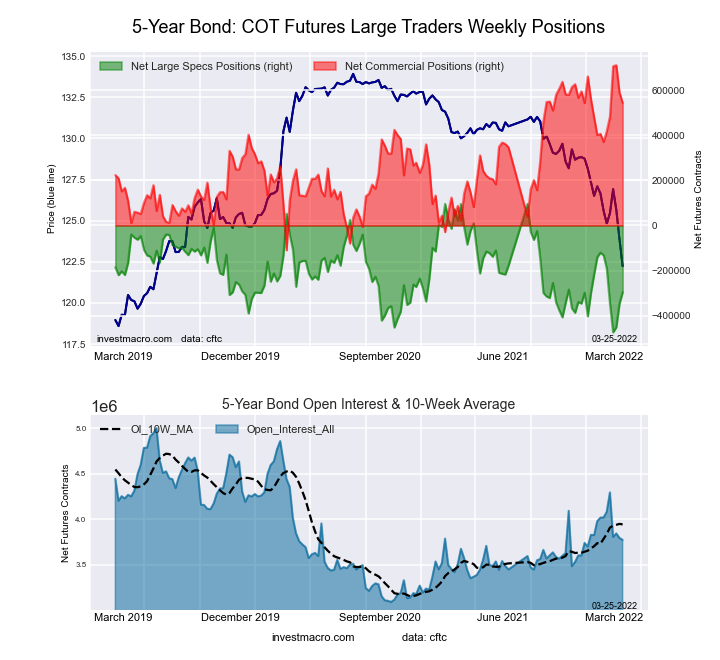
The 5-Year Treasury Note large speculator standing this week equaled a net position of -296,338 contracts in the data reported through Tuesday. This was a weekly lift of 50,964 contracts from the previous week which had a total of -347,302 net contracts.
This week’s current strength score (the trader positioning range over the past three years, measured from 0 to 100) shows the speculators are currently Bearish with a score of 31.2 percent. The commercials are Bullish with a score of 79.7 percent and the small traders (not shown in chart) are Bearish-Extreme with a score of 12.9 percent.
| 5-Year Treasury Note Statistics | SPECULATORS | COMMERCIALS | SMALL TRADERS |
| – Percent of Open Interest Longs: | 9.1 | 81.6 | 7.1 |
| – Percent of Open Interest Shorts: | 16.9 | 67.2 | 13.7 |
| – Net Position: | -296,338 | 544,383 | -248,045 |
| – Gross Longs: | 342,471 | 3,081,019 | 268,697 |
| – Gross Shorts: | 638,809 | 2,536,636 | 516,742 |
| – Long to Short Ratio: | 0.5 to 1 | 1.2 to 1 | 0.5 to 1 |
| NET POSITION TREND: | |||
| – Strength Index Score (3 Year Range Pct): | 31.2 | 79.7 | 12.9 |
| – Strength Index Reading (3 Year Range): | Bearish | Bullish | Bearish-Extreme |
| NET POSITION MOVEMENT INDEX: | |||
| – 6-Week Change in Strength Index: | -28.8 | 21.1 | -2.5 |
10-Year Treasury Note Futures:
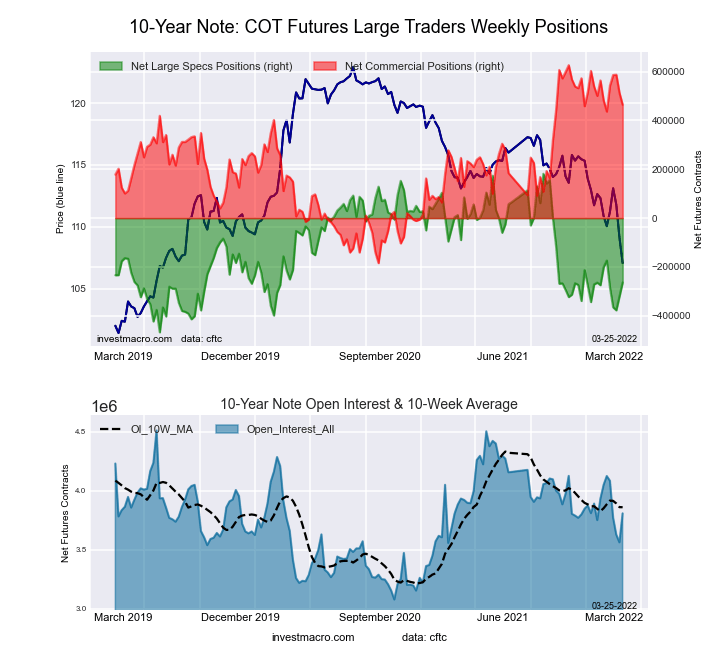
The 10-Year Treasury Note large speculator standing this week equaled a net position of -263,834 contracts in the data reported through Tuesday. This was a weekly advance of 57,163 contracts from the previous week which had a total of -320,997 net contracts.
This week’s current strength score (the trader positioning range over the past three years, measured from 0 to 100) shows the speculators are currently Bearish with a score of 31.4 percent. The commercials are Bullish-Extreme with a score of 80.0 percent and the small traders (not shown in chart) are Bearish with a score of 32.0 percent.
| 10-Year Treasury Note Statistics | SPECULATORS | COMMERCIALS | SMALL TRADERS |
| – Percent of Open Interest Longs: | 10.8 | 77.9 | 7.9 |
| – Percent of Open Interest Shorts: | 17.8 | 65.7 | 13.2 |
| – Net Position: | -263,834 | 464,339 | -200,505 |
| – Gross Longs: | 412,030 | 2,966,196 | 302,390 |
| – Gross Shorts: | 675,864 | 2,501,857 | 502,895 |
| – Long to Short Ratio: | 0.6 to 1 | 1.2 to 1 | 0.6 to 1 |
| NET POSITION TREND: | |||
| – Strength Index Score (3 Year Range Pct): | 31.4 | 80.0 | 32.0 |
| – Strength Index Reading (3 Year Range): | Bearish | Bullish-Extreme | Bearish |
| NET POSITION MOVEMENT INDEX: | |||
| – 6-Week Change in Strength Index: | -9.5 | -2.3 | 18.6 |
Ultra 10-Year Notes Futures:
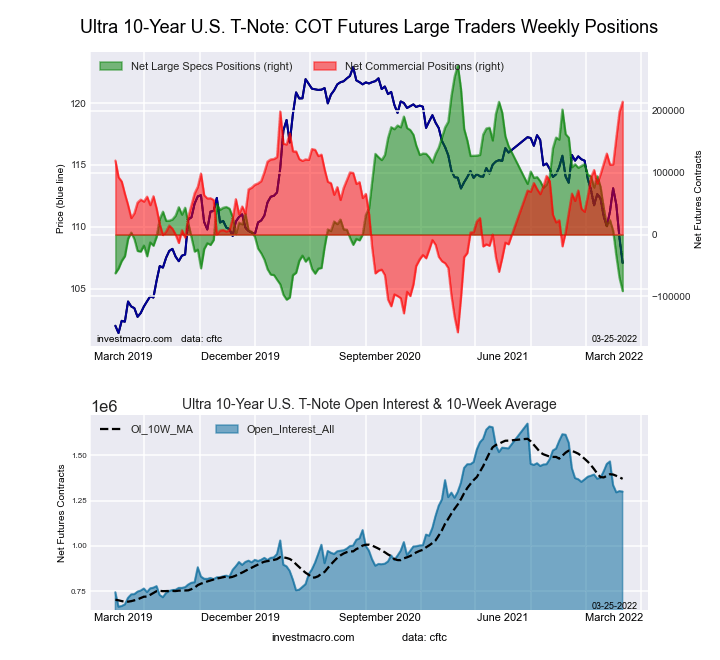
The Ultra 10-Year Notes large speculator standing this week equaled a net position of -91,321 contracts in the data reported through Tuesday. This was a weekly decrease of -21,571 contracts from the previous week which had a total of -69,750 net contracts.
This week’s current strength score (the trader positioning range over the past three years, measured from 0 to 100) shows the speculators are currently Bearish-Extreme with a score of 3.6 percent. The commercials are Bullish-Extreme with a score of 100.0 percent and the small traders (not shown in chart) are Bearish with a score of 41.2 percent.
| Ultra 10-Year Notes Statistics | SPECULATORS | COMMERCIALS | SMALL TRADERS |
| – Percent of Open Interest Longs: | 9.7 | 80.5 | 9.3 |
| – Percent of Open Interest Shorts: | 16.7 | 63.9 | 18.8 |
| – Net Position: | -91,321 | 214,698 | -123,377 |
| – Gross Longs: | 125,921 | 1,045,958 | 120,546 |
| – Gross Shorts: | 217,242 | 831,260 | 243,923 |
| – Long to Short Ratio: | 0.6 to 1 | 1.3 to 1 | 0.5 to 1 |
| NET POSITION TREND: | |||
| – Strength Index Score (3 Year Range Pct): | 3.6 | 100.0 | 41.2 |
| – Strength Index Reading (3 Year Range): | Bearish-Extreme | Bullish-Extreme | Bearish |
| NET POSITION MOVEMENT INDEX: | |||
| – 6-Week Change in Strength Index: | -35.7 | 27.0 | 20.8 |
US Treasury Bonds Futures:
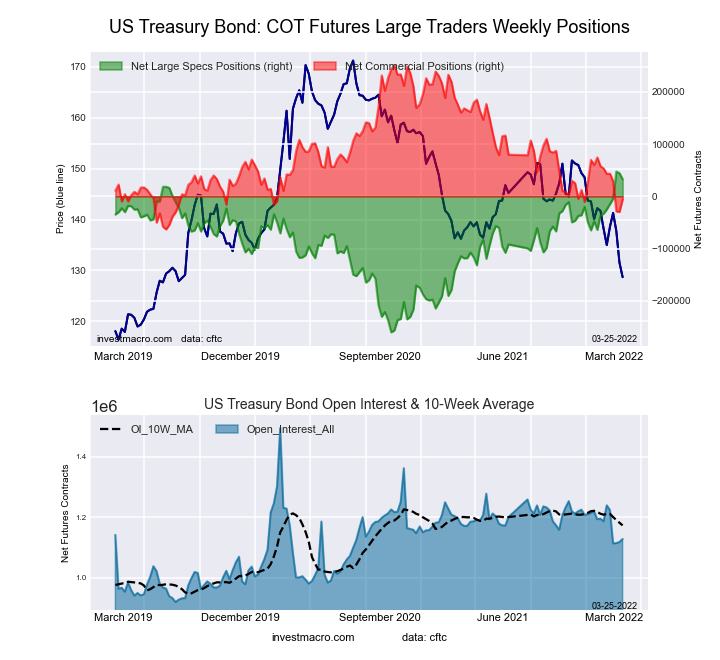
The US Treasury Bonds large speculator standing this week equaled a net position of 32,551 contracts in the data reported through Tuesday. This was a weekly lowering of -11,687 contracts from the previous week which had a total of 44,238 net contracts.
This week’s current strength score (the trader positioning range over the past three years, measured from 0 to 100) shows the speculators are currently Bullish-Extreme with a score of 95.2 percent. The commercials are Bearish-Extreme with a score of 18.4 percent and the small traders (not shown in chart) are Bearish with a score of 31.0 percent.
| US Treasury Bonds Statistics | SPECULATORS | COMMERCIALS | SMALL TRADERS |
| – Percent of Open Interest Longs: | 9.7 | 72.6 | 13.8 |
| – Percent of Open Interest Shorts: | 6.9 | 73.1 | 16.3 |
| – Net Position: | 32,551 | -5,394 | -27,157 |
| – Gross Longs: | 109,965 | 819,658 | 156,236 |
| – Gross Shorts: | 77,414 | 825,052 | 183,393 |
| – Long to Short Ratio: | 1.4 to 1 | 1.0 to 1 | 0.9 to 1 |
| NET POSITION TREND: | |||
| – Strength Index Score (3 Year Range Pct): | 95.2 | 18.4 | 31.0 |
| – Strength Index Reading (3 Year Range): | Bullish-Extreme | Bearish-Extreme | Bearish |
| NET POSITION MOVEMENT INDEX: | |||
| – 6-Week Change in Strength Index: | 21.3 | -18.7 | -5.4 |
Ultra US Treasury Bonds Futures:
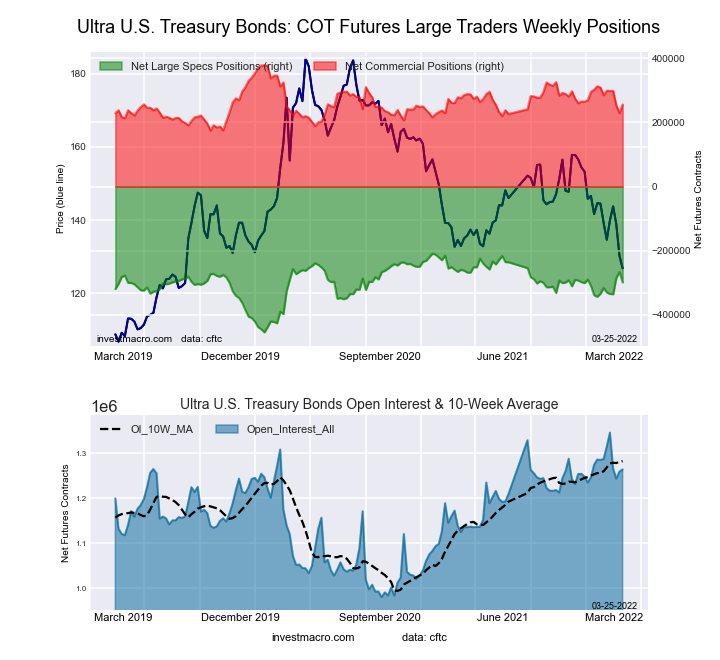
The Ultra US Treasury Bonds large speculator standing this week equaled a net position of -298,523 contracts in the data reported through Tuesday. This was a weekly fall of -32,279 contracts from the previous week which had a total of -266,244 net contracts.
This week’s current strength score (the trader positioning range over the past three years, measured from 0 to 100) shows the speculators are currently Bullish with a score of 63.4 percent. The commercials are Bearish with a score of 40.0 percent and the small traders (not shown in chart) are Bullish with a score of 59.1 percent.
| Ultra US Treasury Bonds Statistics | SPECULATORS | COMMERCIALS | SMALL TRADERS |
| – Percent of Open Interest Longs: | 5.6 | 81.2 | 12.6 |
| – Percent of Open Interest Shorts: | 29.2 | 61.0 | 9.2 |
| – Net Position: | -298,523 | 255,630 | 42,893 |
| – Gross Longs: | 70,425 | 1,026,988 | 158,649 |
| – Gross Shorts: | 368,948 | 771,358 | 115,756 |
| – Long to Short Ratio: | 0.2 to 1 | 1.3 to 1 | 1.4 to 1 |
| NET POSITION TREND: | |||
| – Strength Index Score (3 Year Range Pct): | 63.4 | 40.0 | 59.1 |
| – Strength Index Reading (3 Year Range): | Bullish | Bearish | Bullish |
| NET POSITION MOVEMENT INDEX: | |||
| – 6-Week Change in Strength Index: | 7.1 | -14.1 | 8.3 |
*COT Report: The COT data, released weekly to the public each Friday, is updated through the most recent Tuesday (data is 3 days old) and shows a quick view of how large speculators or non-commercials (for-profit traders) were positioned in the futures markets.
The CFTC categorizes trader positions according to commercial hedgers (traders who use futures contracts for hedging as part of the business), non-commercials (large traders who speculate to realize trading profits) and nonreportable traders (usually small traders/speculators) as well as their open interest (contracts open in the market at time of reporting).See CFTC criteria here.


Comments
Log in or sign up to join the conversation.