
Backwardation, The Bank Of England, And Falling Prices
In commodity markets backwardation is an indicator of physical shortages. Shortages result in buyers bidding up the cash price of the commodity above the future prices. This creates a profitable trade (called decarry) for those holding the physical commodity – they can sell it now and buy a futures contract at a lower price, locking in a profit.
Backwardation should, therefore, be associated with rising prices. However, in a recent Macro Voice podcast, guest Jeffrey Snider noted the anomalous situation in the gold market between 2013 and 2016 where negative gold forward rates (GOFO) indicated backwardation while the gold price was falling. Jeffery’s chart below shows periods where the LBMA GOFO rate was below zero, along with the Bank of England’s custody holdings (gold held on behalf of central banks and bullion banks).
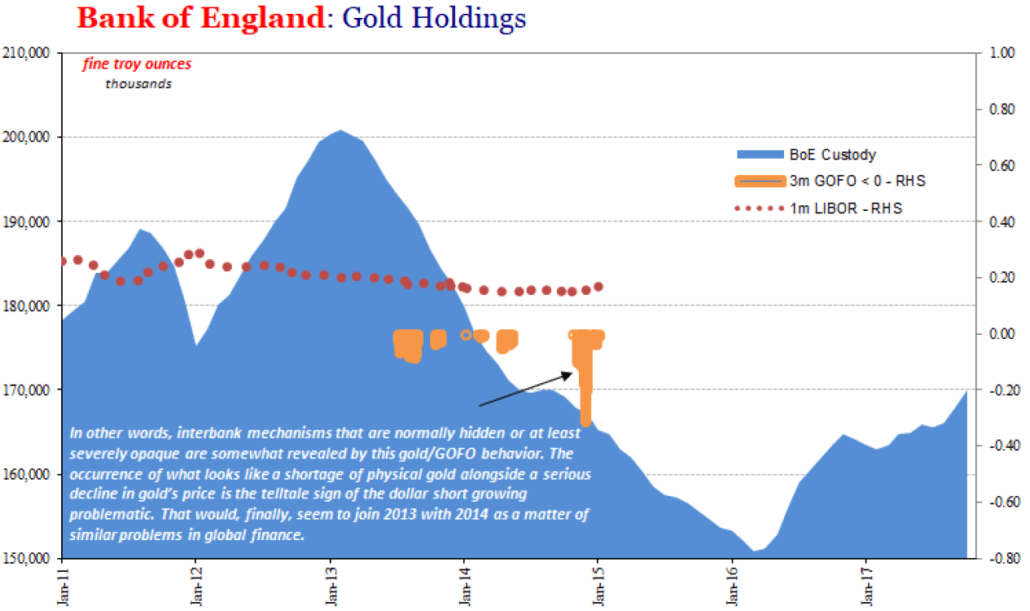
Jeffery sees this unusual situation being related to the Eurodollar market:
“Whenever I see the forward rate go negative, and we see gold disappear from official stores, that tells us that there is a funding problem, a collateral problem, in these global Eurodollar markets.”
Unfortunately, Jeffery’s chart stops at January 2015, as the LBMA discontinued publishing GOFO due to increasing regulatory costs associated with operating a benchmark. Fortunately, Monetary Metals has developed MM GOFO™, a market-derived replacement rate with a very high correlation to the historical LBMA GOFO.
The chart below shows the Bank of England holdings along with the gold held by the US ETF GLD against the times the MM GOFO 3m rate is below zero.
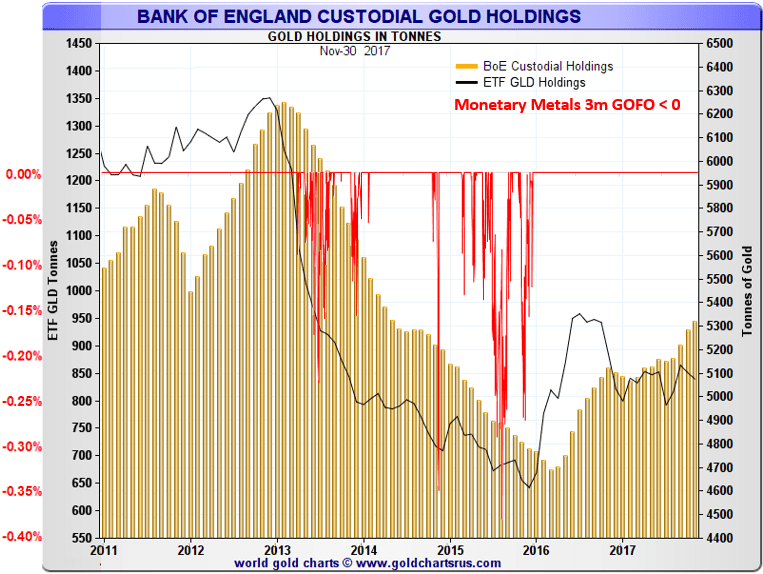
The first time MM GOFO goes negative is April 12, 2013, and again on the 23rd but it is not until mid-May that the rate moves into solid negative territory. It is as this point that a significant amount of gold at the Bank of England starts to be withdrawn. When MM GOFO returns to positive in mid-2014, the Bank of England holdings stabilize but then fall again once MM GOFO drops below zero for the second time.
It is only after MM GOFO rises and stays above zero that gold returns back to the Bank of England. Similar behavior is also exhibited with the holdings of GLD, including the pause in mid-2014. Over the three year period, approximately 1,600 tonnes were withdrawn from the Bank of England and 650 tonnes from GLD.
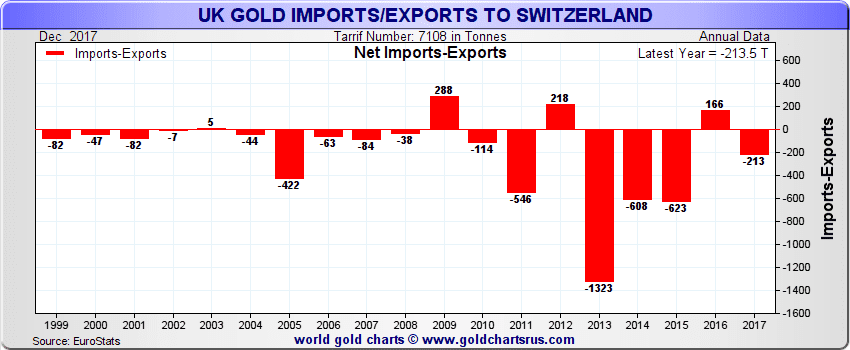
Where did all that metal go? For the three years 2013 to 2015 the UK net exported 2,385 tonnes, with the largest recipient being Switzerland for re-refining and eventual shipment to Asia.
This period is of particular interest to gold investors because it was in April 2013 that the gold price broke support levels and crashed from the $1600s to below $1300, all the while there was booming demand from Asia. The chart below shows this time period, comparing the gold price to MM GOFO. It cannot be coincidental that MM GOFO first moved below zero, and Bank of England withdrawals picked up speed, in April as well.
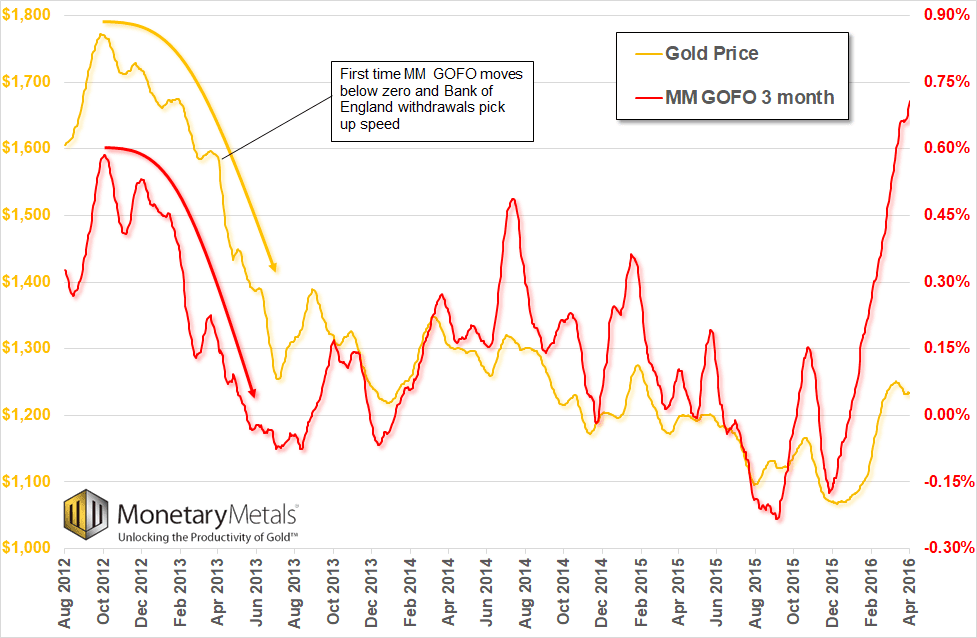
In hindsight, both the gold price and MM GOFO had their last peak in October 2012 before rolling over with GLD and Bank of England holdings peaking later in December 2012 and February 2013, respectively.
While we do not discount the impact of the Eurodollar funding/collateral issues Jeffery identifies, we consider the fact that forward rates were falling along with the price as indicative of another dynamic in play. Regular readers may get a hint when we note that forward rates are another way of looking at a topic we discuss every week in our Supply and Demand reports – the basis and cobasis.
For a forward rate (or basis) to fall, it means that the difference between futures prices and spot prices must be getting smaller. In commodity markets, this manifests as the spot price being bid up faster than the rate at which futures prices are also rising, closing the gap to futures. Eventually, spot moves above futures, resulting in backwardation.
However, in the case of gold, the fact that the stock of gold above ground is equal to over 60 years’ worth of mine production means that gold is not a typical commodity and cannot really ever be in shortage.
In the case of 2013, the falling forward (basis) rate indicated that it was futures prices which were falling faster than spot, closing the gap, until futures fell below spot, giving us negative MM GOFO. The driver for this behavior is the leverage inherent in futures contracts: futures traders are under more pressure to liquidate positions once they move against them that those holding fully paid physical (spot) gold.
As we see in the chart above, while forward rates were positive they were in a falling trend from late 2012 onwards. Positive forward rates mean it is profitable to carry gold – buying physical gold at spot, storing (or carrying it) and selling a futures contract against it at a higher price – but this profit was declining into early 2013.
Once rates moved below zero in April 2013, the market moved into a situation where decarry became profitable. Thus bullion banks with physical gold at the Bank of England were incentivized to sell that gold in the spot market and buy it back at a lower price, via futures or forward purchases (from a mining company, for example).
This decarry pressure remained until early 2016 when the gold market bottomed and forward rates began to rise on the back of resurgent dollar interest rates, shifting the market back to the more normal contango state where the incentive was to carry gold. It is no surprise that stocks of gold held at the Bank of England recovered at this time, increasing by 600 tonnes.
Disclosure: None
Speculative versus fundamental demand is something Monetary Metals also aims to identify with our more


