
Australian Dollar Price Outlook: Aussie Plunges To Technical Support
The Australian Dollar plummeted more than 2.2% against the US Dollar since from the October highs with price responding to confluence support this week. While the broader risk remains lower, the immediate focus is on this near-term recovery in price. These are the updated targets and invalidation levels that matter on the AUD/USD price charts.
AUSTRALIAN DOLLAR PRICE CHART – AUD/USD DAILY
(Click on image to enlarge)
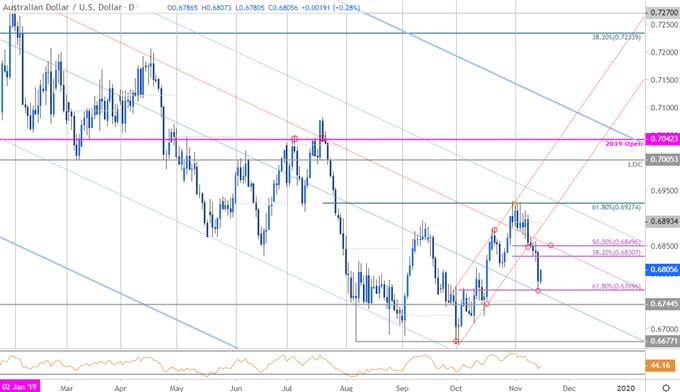
Chart Prepared by Michael Boutros, Technical Strategist; AUD/USD on Tradingview
Technical Outlook: In my latest Australian Dollar Price Outlook we highlighted, “Key resistance steady at 6880 with a breach/close above needed to fuel the next leg higher in price targeting 6927.” Aussie ripped higher into the close of October with price registering a high at 6929 before turning lower to breaking channel support early in the month. The decline responded to confluence support this week at 6768/70- where the 61.8% Fibonacci retracement of the monthly decline and the yearly low-week close converge on the median-line of the broad descending pitchfork formation we’ve been tracking off the 2017 / 2018 swing highs.
AUSTRALIAN DOLLAR PRICE CHART – AUD/USD 120MIN
(Click on image to enlarge)
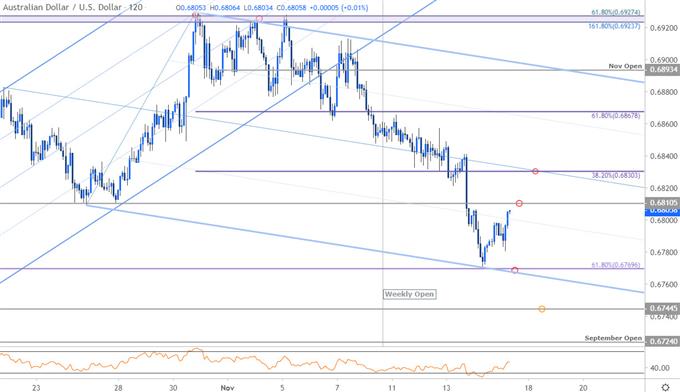
Notes: A closer look at Aussie price action shows AUD/USD trading within the confines of a descending pitchfork formation extending of the October highs with the lower parallel further highlighting near-term support at 6768/70. Initial resistance objectives approaching at 6810 and 6830- look for a reaction there IF reached.
A breach above 6830 would shift the focus back to the long-side in price targeting 6850 and 6868. A break below key support at 6768/70 would likely see accelerated losses for Aussie with such a scenario exposing 6745 and the September open at 6724.
Bottom line: The Australian Dollar sell-off has responded to long-term downtrend support at 6768/70. From at trading standpoint, the immediate focus is on this near-term recovery – look for a reaction/pivot on a stretch towards slope resistance for guidance (ultimately, a breach is favored). Use caution here – this is a big level and a break lower from here would likely see accelerated losses for Aussie.
AUSTRALIAN DOLLAR TRADER SENTIMENT – AUD/USD PRICE CHART
(Click on image to enlarge)
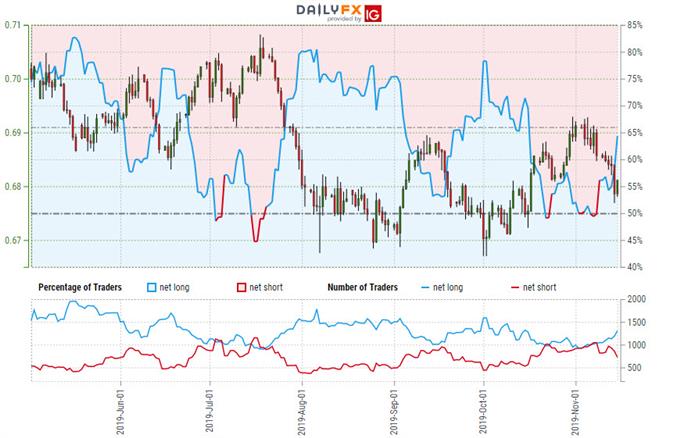
- A summary of IG Client Sentiment shows traders are net-long AUD/USD - the ratio stands at +1.70 (63.01% of traders are long) – bearish reading
- Long positions are 4.66% higher than yesterday and 20.28% higher from last week
- Short positions are1.44% lower than yesterday and 25.02% lower from last week
- We typically take a contrarian view to crowd sentiment, and the fact traders are net-long suggests AUD/USD prices may continue to fall. Traders are further net-long than yesterday and last week, and the combination of current positioning and recent changes gives us a stronger AUD/USD-bearish contrarian trading bias from a sentiment standpoint.


