
Australian Dollar In The Hot Seat
In a few hours, Australia will release their employment data for October, with the Unemployment Rate expected to downtick from 5.3% in September to 5.2%. However, the key figure will be the employment change, with expectations of an increase of 18,000 jobs in October vs an increase of 14,700 in September. Australia does something nice for us; they breakdown the headline number between full-time jobs and part-time jobs. This distinction gives a clearer picture of how the overall job market is doing. Expectations for October are for an increase of 34,000 full-time jobs and a decrease of 16,000 part-time jobs! These expectations are both better than September’s numbers. If these numbers come out as expected, full-time jobs will be increasing and part-time jobs will be decreasing MoM! Australia could use some positive data, as the US-China trade deal headlines have mainly been the driver of the Australian Dollar. Earlier today, “sources”, said that US-China trade talks have hit a snag.
AUD/USD has closed down the last 4 days (although the range has only been about 80 pips over that period). Recent highs were near-horizontal resistance at .6913. The pair spiked through that level 4 days in a row earlier this month, however, could not close above the resistance. Perhaps that was because of the downward sloping trendline just above at near .6935 and the 200-day moving average at .6942. Could the employment data be the catalyst to reverse that and help propel the pair to new highs?
(Click on image to enlarge)
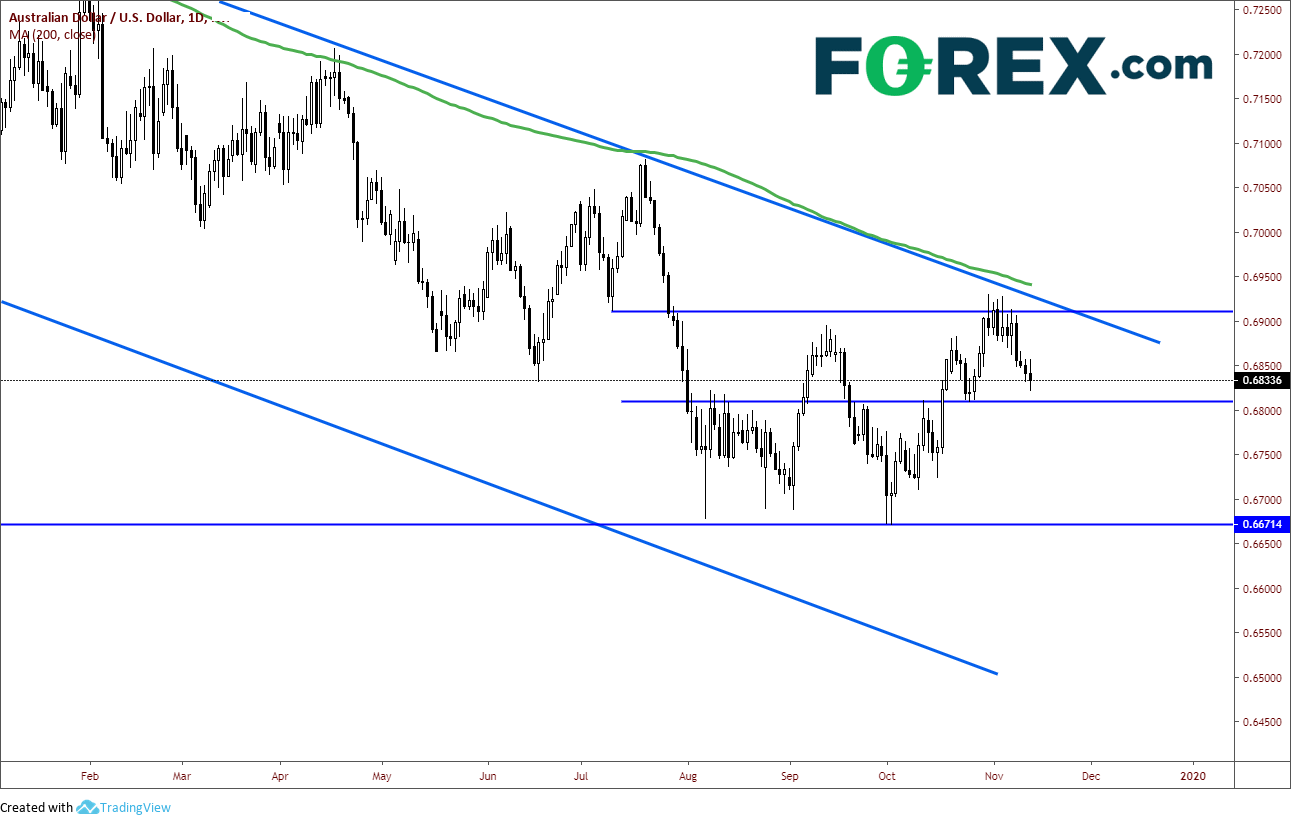
Source: Tradingview, FOREX.com
On a 240-minute timeframe, AUD/USD is trying to hold the bottom trendline of rising channel near .6832. This price coincides with the 38.2% Fibonacci retracement level from the lows on October 2nd to the highs on October 31st. If price breaks lower, first support is horizontal support near .6810 down to .6800, which is the 50% retracement of the previously mentioned timeframe. This is also a psychological support level, as it is a nice round number (which markets seem to pay attention to). There is a falling wedge within the channel that has formed on the 240-minute chart. If price breaks out to the top side, the target for the breakout of a falling wedge is a 100% retracement, which would be right at the horizontal resistance on the daily timeframe at .6913. Above that, watch for the resistance levels mentioned on the daily timeframe.
(Click on image to enlarge)

Source: Tradingview, FOREX.com
When the Australian Employment data is released, make sure to dig deeper into the headline data and look at the number of full-time jobs created vs the number of part-time jobs created. The difference could be a reason the AUD/USD will go bid or sell off!
Disclosure: None.


