Australian Dollar Forecast: AUD/USD, AUD/JPY Test Key Resistance
The Australian Dollar has rallied against some of its “safer” counterparts in the US Dollar and Japanese Yen even as trade war concerns flared early this week. Consequently, risk appetite took a hit, but relatively optimistic remarks from Governor Lowe at Tuesday’s RBA rate decision helped keep AUD/USD and AUD/JPY afloat – despite the broader rotation into the haven currencies. Now, the two pairs are nearing trendlines that have been crucial for the Australian Dollar’s longer-term deterioration.
AUD/USD PRICE CHART: DAILY TIME FRAME (OCTOBER 2018 – DECEMBER 2019) (CHART 1)
(Click on image to enlarge)
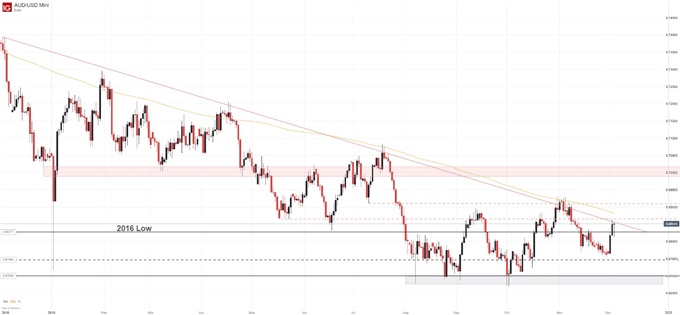
To be sure, defining a clear-cut outlook for the Australian Dollar is difficult at this stage and it may all come down to the efficacy of technical levels and the status of risk trends. Nevertheless, we can highlight the relevant levels in an attempt to outline potential positions depending on your bias. For AUD/USD, the pair’s medium-term outlook is highly contingent on the nearby trendline and 200-day moving average. Resting at the 0.6851 and 0.6883 levels respectively, the two topside barriers will look to rebuke an extension higher and keep the longer-term AUD/USD downtrend intact.
(Click on image to enlarge)
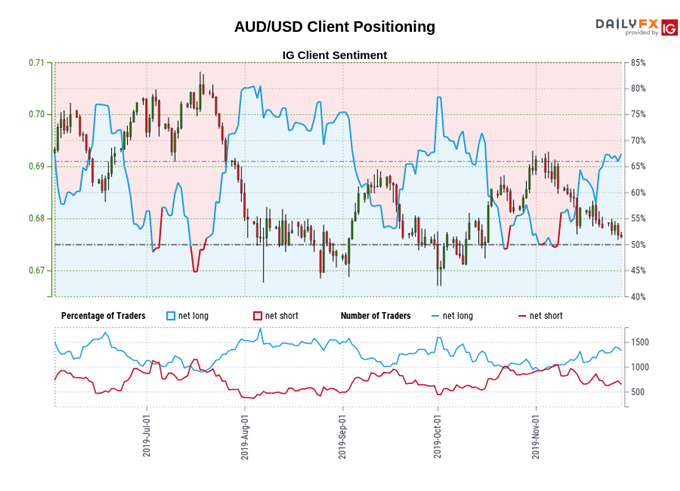
If bulls can breakthrough, the pair may look to extend higher and capitalize on newfound support in the form of prior resistance. That being said, such a shift in direction would likely require a deeper fundamental catalyst, which seems absent at this time. Consequently, the broader AUD/USD weakness may continue in the weeks ahead. IG Client Sentiment Data suggests a similar bias, with traders overwhelmingly net-long AUD/USD – suggesting prices may soon fall. For a deeper look at client sentiment on both AUD/USD and AUD/JPY.
AUD/JPY FORECAST
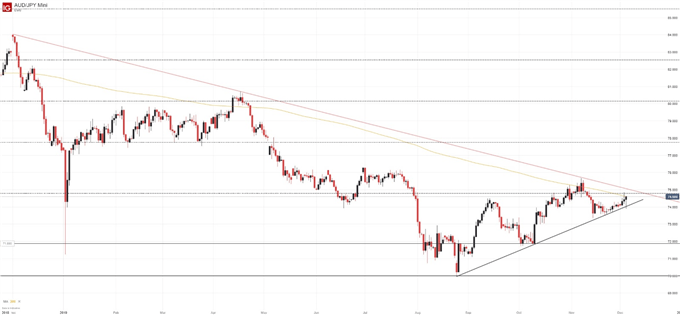
Shifting focus to AUD/JPY, price action reveals a trend like that of AUD/USD. Stuck in a broader decline, AUD/JPY has recently rebounded to test topside resistance around 75.00. Similarly, the 200-day moving average is nearby and will also look to influence price. As the pair runs out of room between the descending trendline from December 2018 and the ascending line from August 2019, a break will have to materialize – likely out of necessity at this point.
AUD/JPY PRICE CHART: DAILY TIME FRAME (OCTOBER 2018 – DECEMBER 2019) (CHART 2)
(Click on image to enlarge)
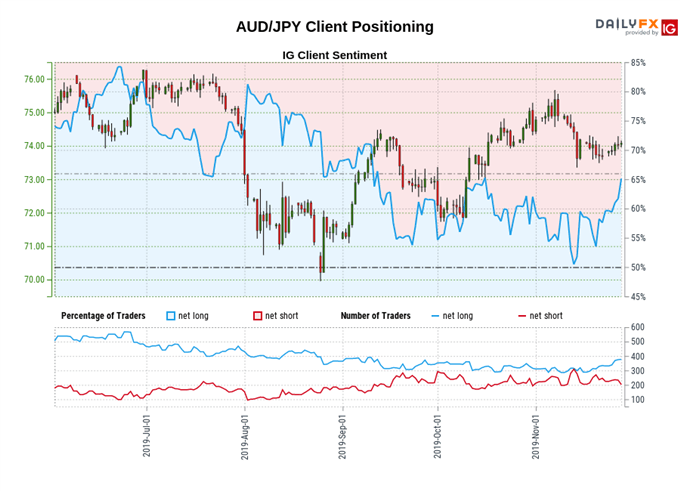
Again, turning to IG Client Sentiment Data as the deciding factor, client positioning suggests resistance may rebuke AUD/JPY once again and force a break lower. Should a breakdown occur, initial areas of buoyancy may look to reside around 73.00 before stronger horizontal support at 72.00 can come into play.
(Click on image to enlarge)