AUD/USD Price Outlook: Aussie-Dollar Eyes Key Data On Deck
The Australian Dollar struggled to find direction on Wednesday with AUD/USD set to close flat for the session. AUD/USD price action has consolidated slightly higher to form a rough 50-pip range since stumbling sharply lower earlier this week. Australian Dollar weakness looked owed in part to news of a China ban on Australian Coal.
FX traders could also be front-running the possibility that RBA Governor Philip Lowe might give the green light for further monetary policy accommodation. However, AUD/USD bears have hesitated about making a sustained push lower. This is largely considering US Dollar volatility fueled by fiscal stimulus whiplash. That said, as market participants come to grip with the slim chance that coronavirus aid will get passed by US politicians prior to the election, spot AUD/USD price action might continue to face headwinds.
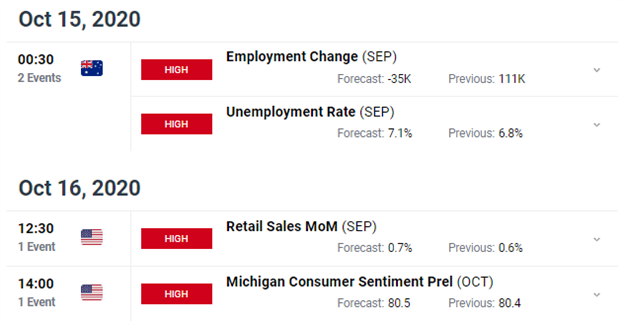
AUD/USD - DAILYFX ECONOMIC CALENDAR
(Click on image to enlarge)

Chart Source: DailyFX Economic Calendar
Looking to the DailyFX Economic Calendar brings to focus a few notable datapoints out of Australia and the United States later this week, which have potential to weigh materially on AUD/USD price action as well. Aussie jobs data scheduled for release Thursday, 15 October at 00:30 GMT could underscore calls for more RBA easing if the employment figures disappoint. US retail sales and consumer sentiment reports due Friday, 16 October at 12:30 GMT and 14:00 GMT respectively stand to have an impact on trader risk appetite and demand for safe-haven currencies like the US Dollar.
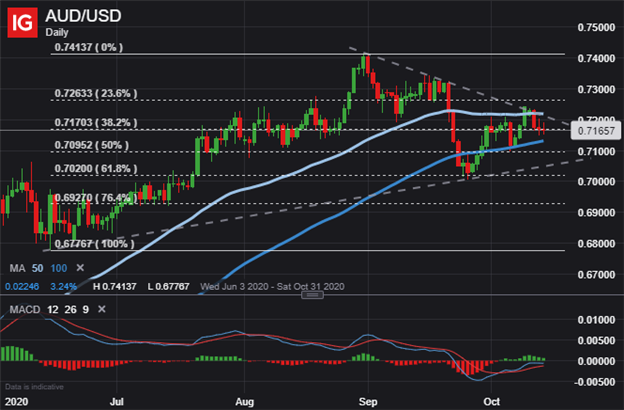
AUD/USD PRICE CHART: DAILY TIME FRAME (03 JUN TO 14 OCT 2020)
(Click on image to enlarge)

Chart by:@RichDvorakFX
Trader indecisiveness regarding where to push the Aussie-Dollar next has resulted in the formation of back-to-back doji candlestick patterns. The sideways direction could press on with spot AUD/USD price action looking relatively contained between its 50-day and 100-day simple moving averages. Not to mention, the major currency pair also gravitates around a confluent support zone highlighted by its 38.2% Fibonacci retracement of the 15 June to 31 August bullish leg.
Yet, potential that AUD/USD breaks lower could be a more likely outcome as spot rates form a bearish trend from the series of lower highs over the last month and a half. The MACD indicator also points to a possible impending bearish crossover. On the other hand, a topside breakout above the negatively sloped trendline could open up the door for Aussie-Dollar bulls to make a push toward the 0.7300-handle. This scenario could materialize if there is a fiscal stimulus breakthrough and market volatility stays relatively suppressed.


