

Image Source: Unsplash
- AUD/USD pushes for a second day of recovery after near-term rebound.
- Australian Retail Sales on the offer early Tuesday.
- US long weekend holiday leaves Monday volumes thin.
AUD/USD found some room on the high side on Monday after US markets dark for the Memorial Day holiday left the Greenback on the low side, propping up the Aussie and extending Friday’s recovery into a second day. AUD traders will be looking ahead to Tuesday’s Australian Retail Sales in April, while US Personal Consumption Expenditure (PCE) inflation data looms ahead later in the week.
Australian MoM Retail Sales in April are expected to recover to 0.2% after the previous month’s 0.4% decline. Looking further ahead to Wednesday, Australian Monthly Consumer Price Index (CPI) inflation in April is expected to grow at 3.4% YoY compared to the previous month’s annualized 3.5%.
Talking points from Federal Reserve (Fed) officials are expected to resume dominating headlines this week after US markets return to action after a long weekend holiday. A slew of Fed policymakers are expected to make appearances throughout the week.
Friday will cap off the economic calendar with a fresh print of US PCE Price Index inflation. Investors hope Core PCE Price Index inflation in April will hold steady at 0.3%. If the number comes out higher, inflation remains a key problem for the US and could shatter risk appetite, while a lower-than-expected print will send investor sentiment soaring.
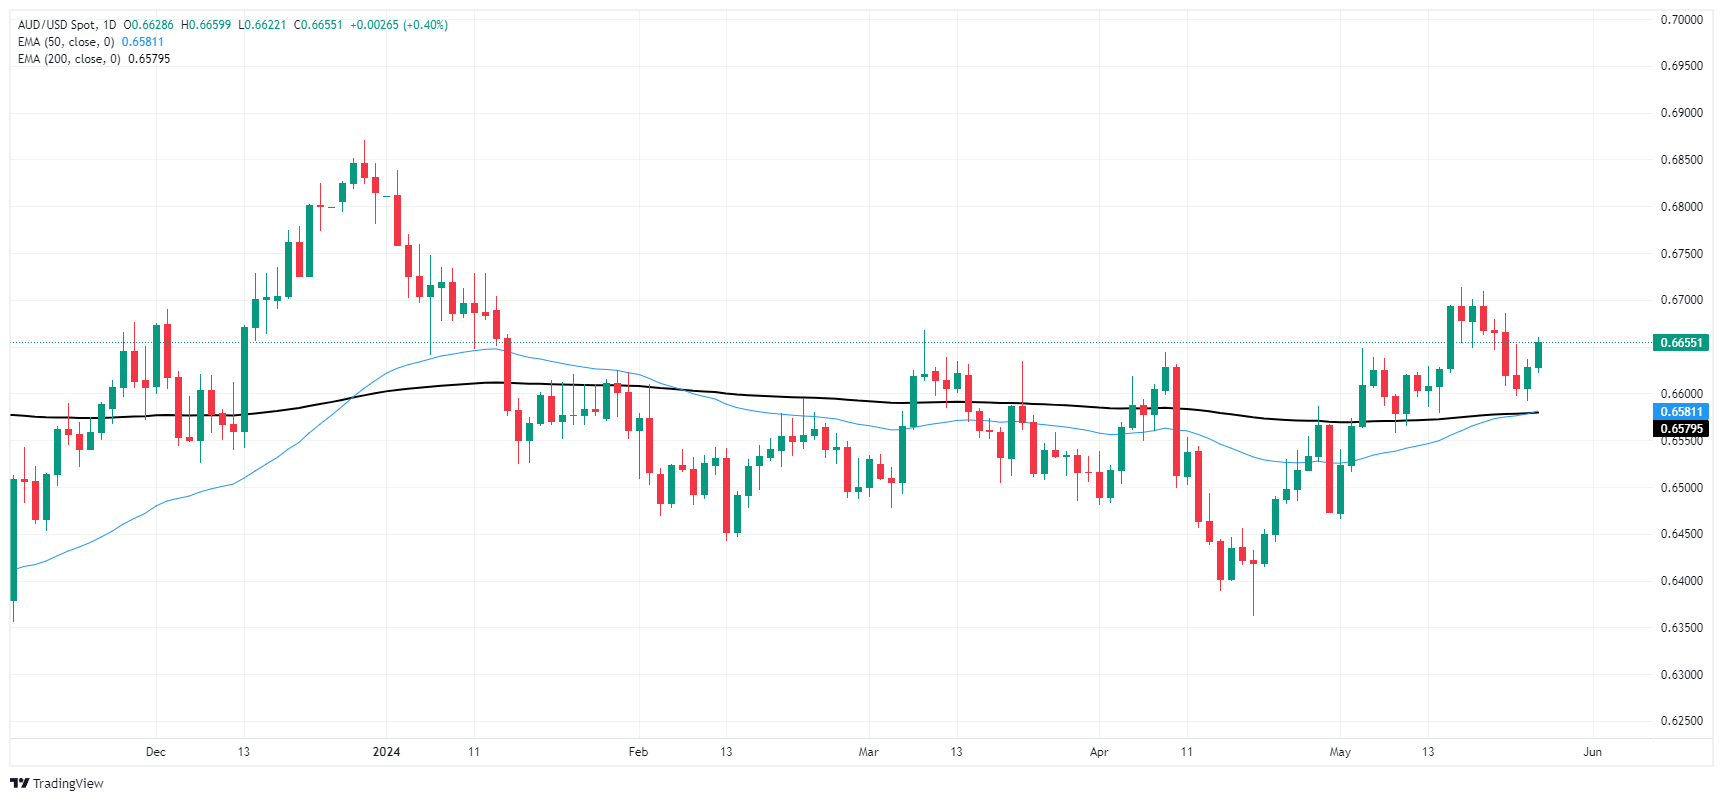
AUD/USD technical outlook
Despite getting knocked back below 0.6700 last week, the Aussie remains on the high side of the 200-day Exponential Moving Average (EMA) at 0.6575. The pair has been holding on the bullish side since recovering from a swing low into 0.6360 in April, but still remains down from 2024’s opening bids above 0.6800.
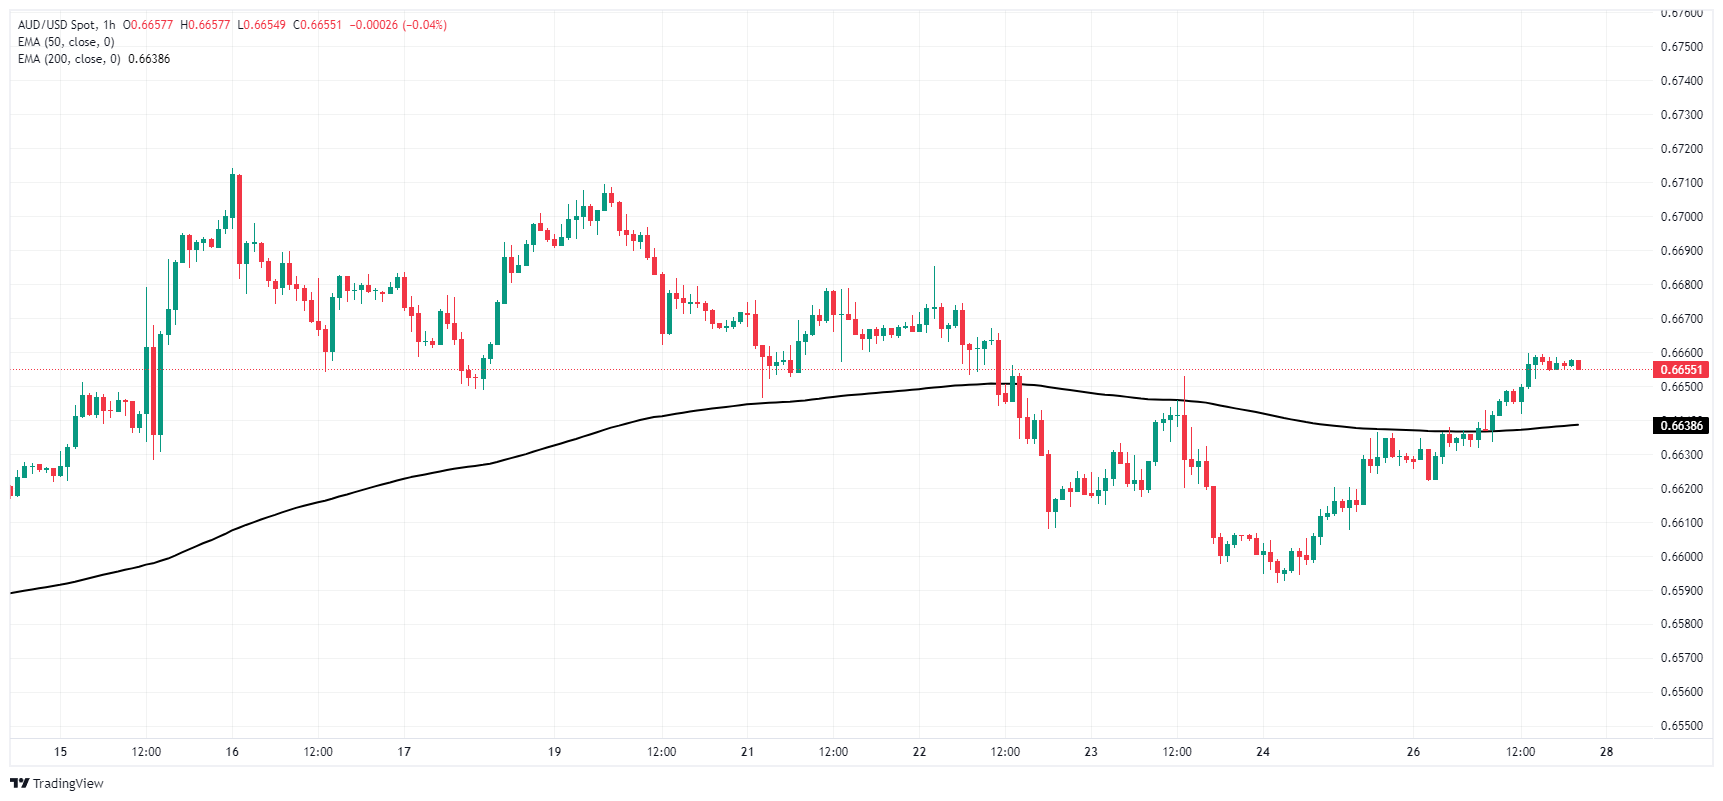
AUD/USD hourly chart
AUD/USD daily chart
AUD/USD
| OVERVIEW | |
|---|---|
| Today last price | 0.6656 |
| Today Daily Change | 0.0027 |
| Today Daily Change % | 0.41 |
| Today daily open | 0.6629 |
| TRENDS | |
|---|---|
| Daily SMA20 | 0.6612 |
| Daily SMA50 | 0.6555 |
| Daily SMA100 | 0.6562 |
| Daily SMA200 | 0.6531 |
| LEVELS | |
|---|---|
| Previous Daily High | 0.6636 |
| Previous Daily Low | 0.6592 |
| Previous Weekly High | 0.6709 |
| Previous Weekly Low | 0.6592 |
| Previous Monthly High | 0.6644 |
| Previous Monthly Low | 0.6362 |
| Daily Fibonacci 38.2% | 0.662 |
| Daily Fibonacci 61.8% | 0.6609 |
| Daily Pivot Point S1 | 0.6602 |
| Daily Pivot Point S2 | 0.6575 |
| Daily Pivot Point S3 | 0.6557 |
| Daily Pivot Point R1 | 0.6646 |
| Daily Pivot Point R2 | 0.6663 |
| Daily Pivot Point R3 | 0.669 |
More By This Author:
USD/JPY Steady On Friday After Another Week Of GainsCanadian Dollar Pares Losses On Friday Despite Downturn In Canadian Retail Sales
EUR/USD Slips Further Back On Thursday As Rate Cut Hopes Dry Up


Comments
Log in or sign up to join the conversation.