

The AUDUSD pair is building a large cycle correction b. This has the structure of a primary double zigzag Ⓦ-Ⓧ-Ⓨ.
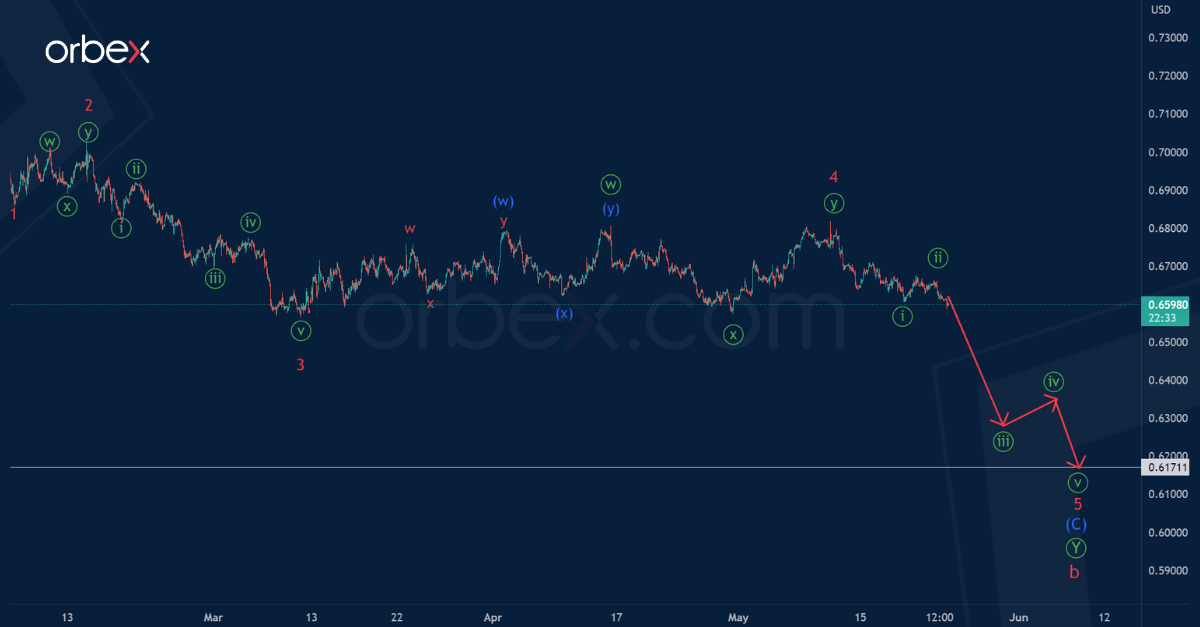
The current chart shows the structure of the last part of the intermediate wave (C). This consists of minor sub-waves 1-2-3-4-5. There is a high probability that the impulse (C) will end at a minimum of 0.617, which was marked by the impulse wave (A).
An approximate scheme of possible future movement is shown on the chart.
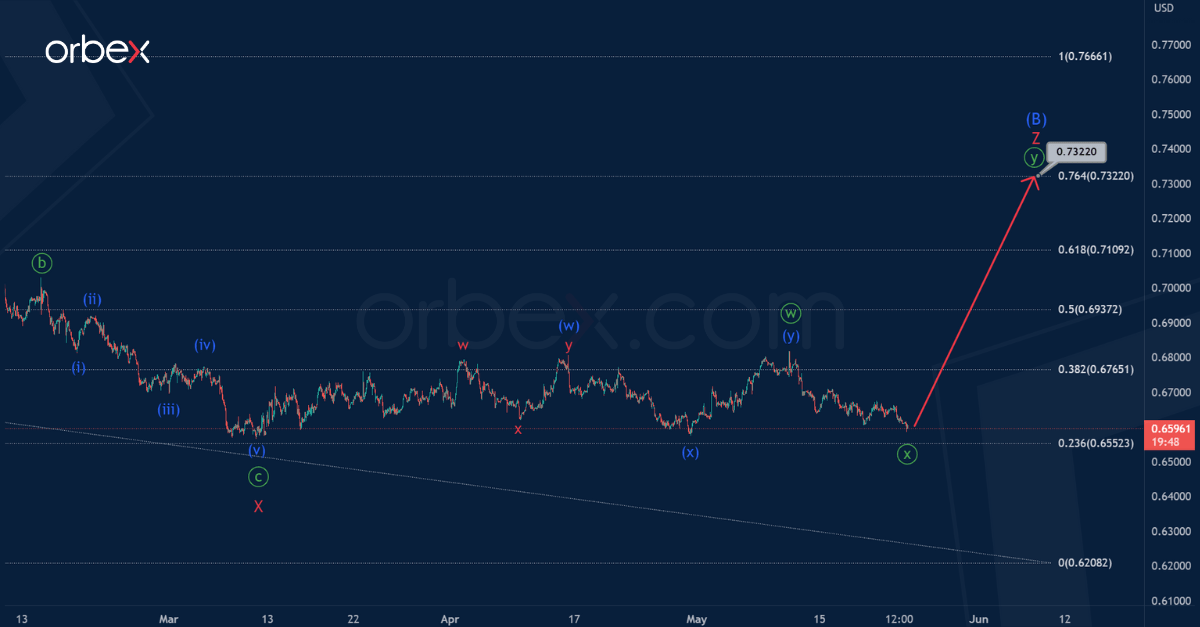
Let’s consider an alternative scenario. On the current chart, we see an incomplete intermediate correction (B).
The bullish correction (B) has a complex internal structure of the triple zigzag W-X-Y-X-Z, as in the main version, but its finale awaits us a little higher.
There is a high probability that in the last section we see the construction of a minor wave Z. This wave could end in the form of a minute double zigzag near 0.732.
At the level of 0.732, correction (B) will be at 76.4% of impulse (A).
More By This Author:
SPX500 Impulse To End Towards $5K
Intraday Analysis – USD Continues To Bounce
Is The Tech Rally Nearly Over?

Comments
Log in or sign up to join the conversation.