
AUD/NZD Bearish Break Offers Wide Open Space To Fib Levels
The AUD/NZD has been in range for more than 5 year on the monthly chart (price action hitting the 21 ema zone). Price is now showing a potential bearish breakout with 100-300 pips space.
But the Fibonacci levels could also act as support zones… Let’s review the monthly and 4 hour charts.
Price Charts and Technical Analysis
(Click on image to enlarge)
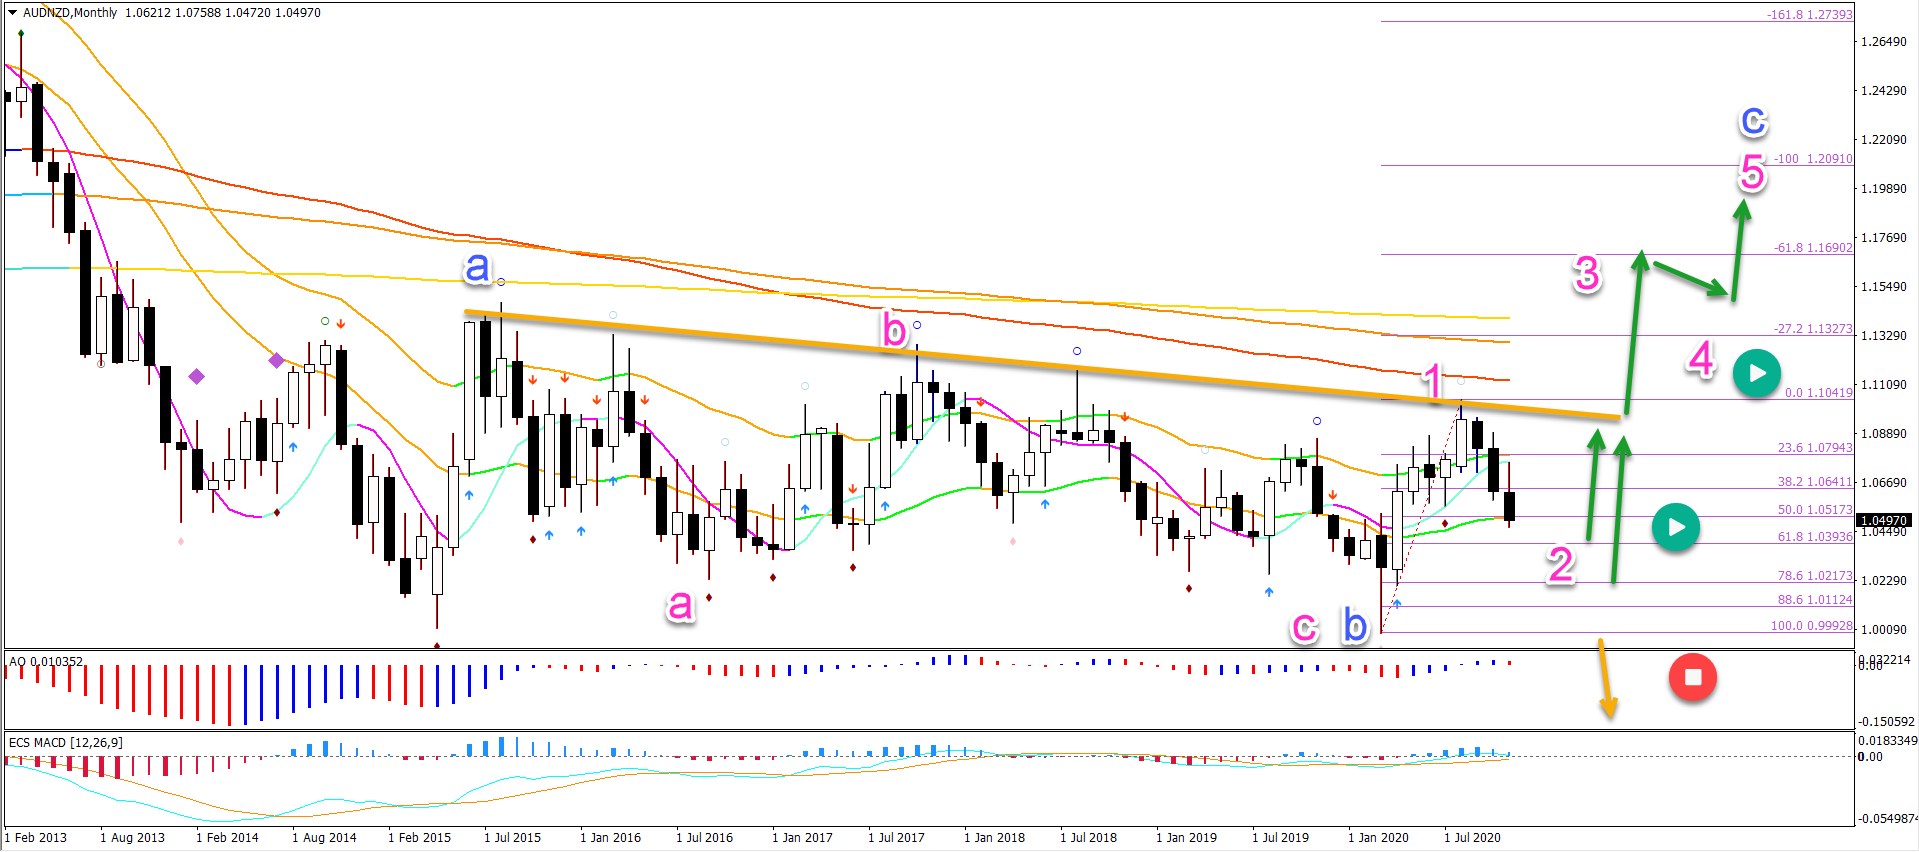
The AUD/NZD seems to be building a large ABC (blue) pattern. Although this wave outlook is fragile to the choppy consolidation zone.
If a larger wave C (blue) does occur, then price is expected to make a bullish bounce at the Fibonacci retracement levels. Price should also break above the resistance trend line (orange) if a 5 wave pattern emerges (pink).
A break below the bottom invalidates (red circle) the bullish outlook. This confirms a bearish breakout below the range and also a full downtrend.
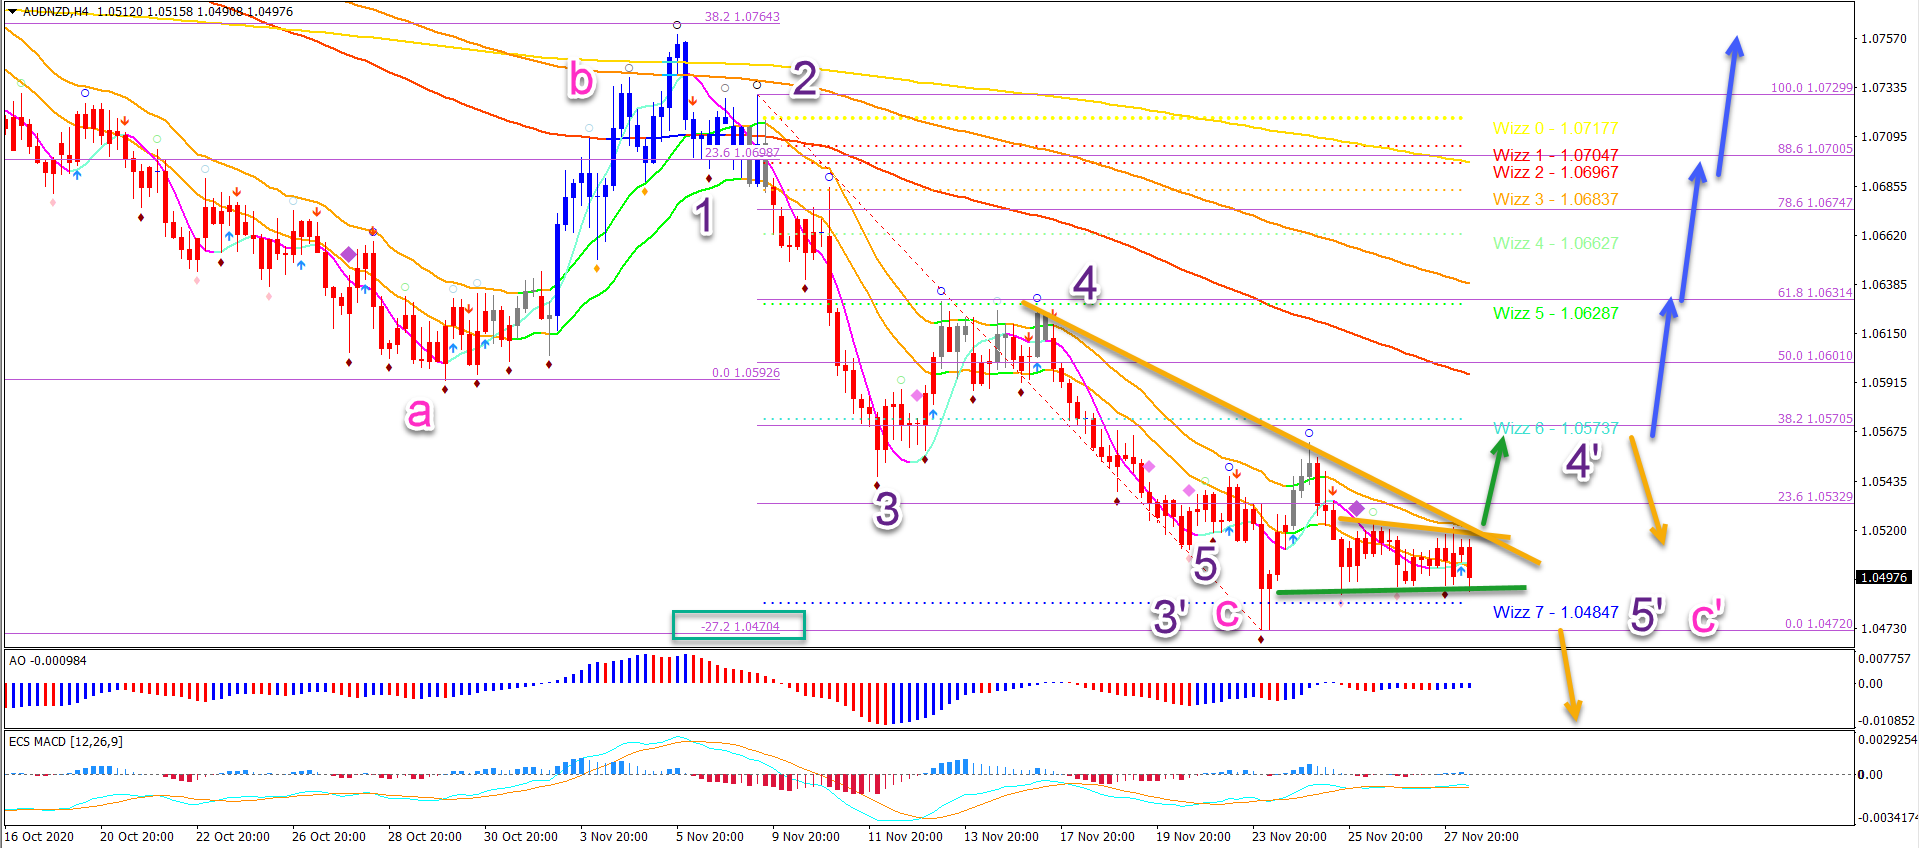
On the 4 hour chart, price could have completed a wave 5 (purple) of a larger ABC (pink) pattern at the -27.2% Fibonacci target (green box) and 50% Fib on the monthly chart.
- But price action must break above the 21 ema zone and then the 38.2% resistance Fib to confirm that (blue arrows).
- A bearish breakout below the support zone (green line) or a bearish bounce at the 38.2% Fibonacci zone could confirm the bearish outlook.
It remains likely that price action will move lower to test at least the 61.8% Fib at 1.04 if not the 78.6% Fibonacci retracement level at 1.0220 on the monthly chart. Also, the -61.8% Fibonacci targets form a confluence at 1.0310.
(Click on image to enlarge)
Disclaimer: The opinions in this article are for informational and educational purposes only and should not be construed as a recommendation to buy or sell the stocks mentioned or to solicit ...
more

