
The AUD/JPY market showcases an increasingly bullish trend. The cross stabilized at 100.89 on Wednesday, after rallying to a high at 101.12, its highest since 2014. The general market interest leans towards the buyers as the pair follows an upward trend and surpasses significant levels. However, as the pair gained nearly 1.50% in the last sessions, the cross might be poised for a correction.
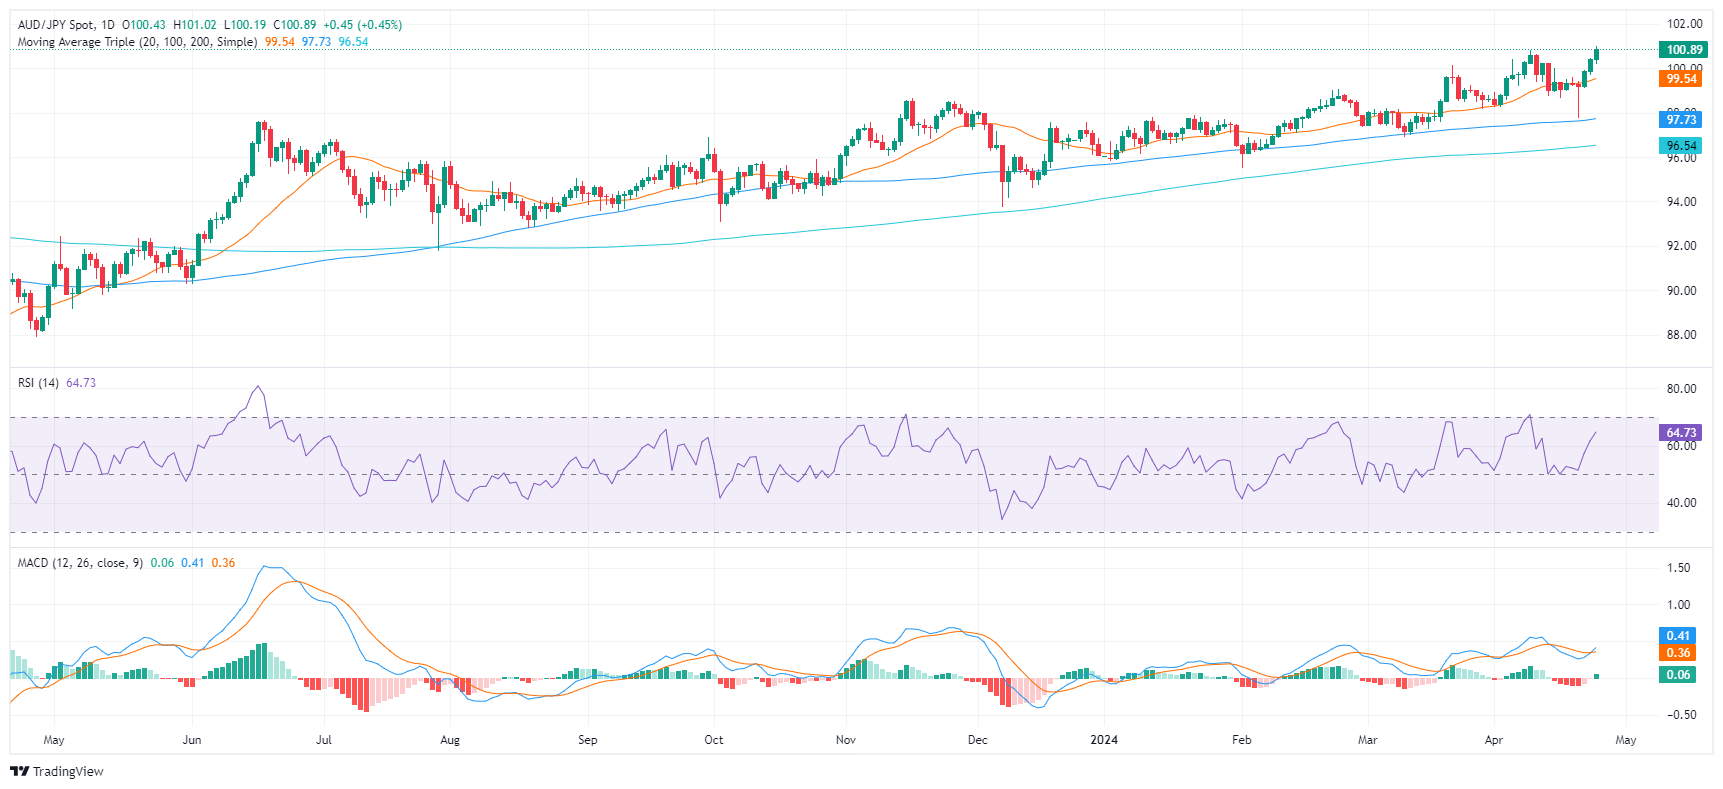
On the daily chart, the Relative Strength Index (RSI) of the AUD/JPY pair continues its upward trajectory nearing overbought territory. The Moving Average Convergence Divergence (MACD) also supports the buyers, as it prints a fresh green bar.
AUD/JPY daily chart
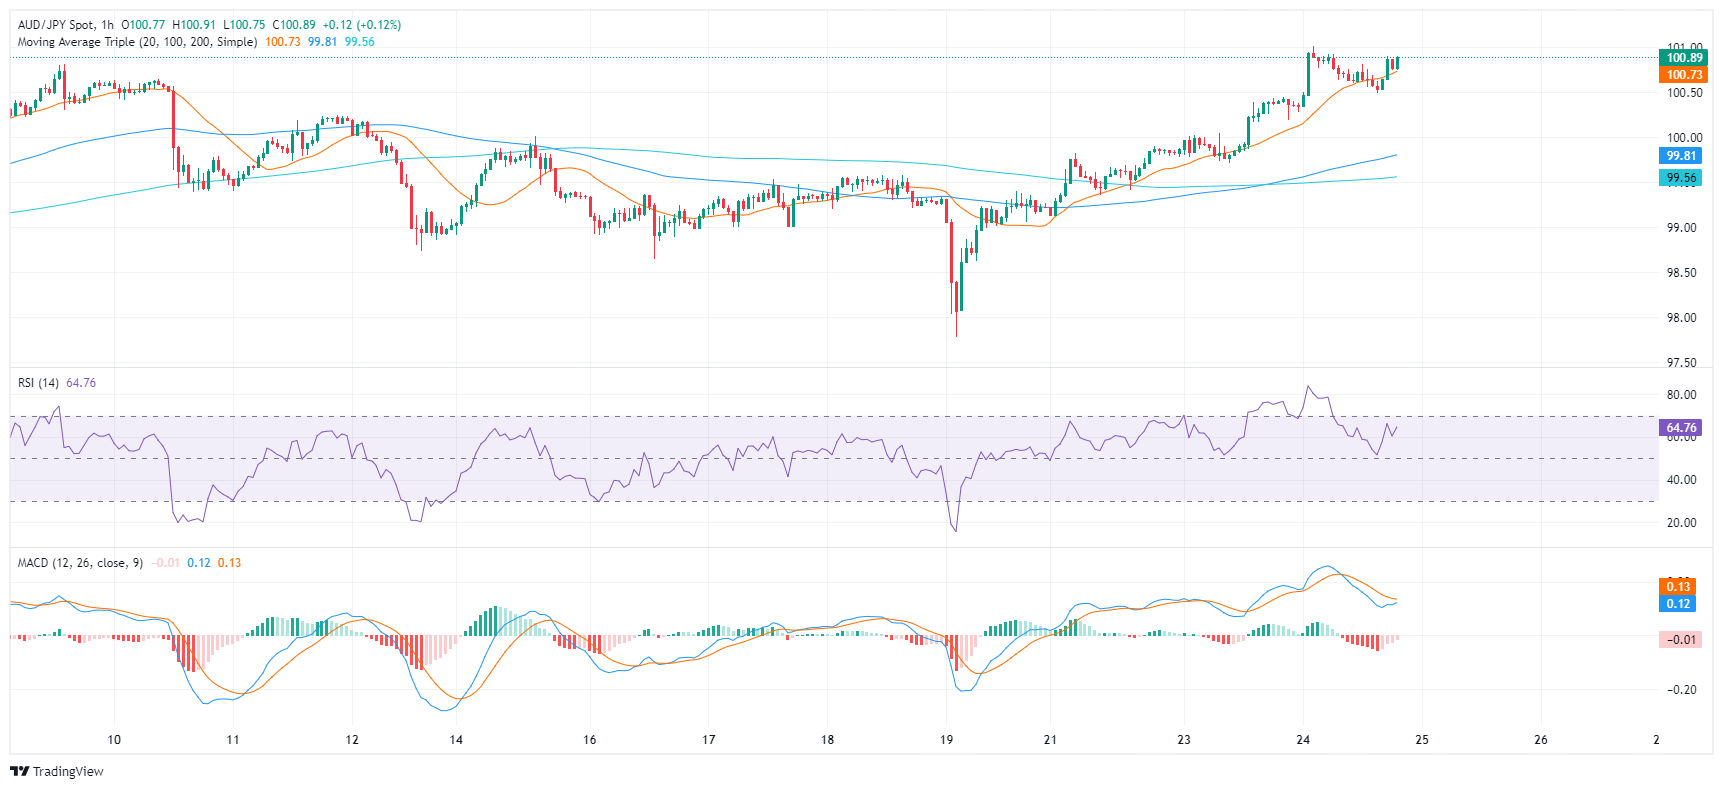
Switching the focus to the hourly chart, the hourly Relative Strength Index (RSI) displays a generally increasing trend, pointing toward positive short-term momentum. In addition, the MACD portrays decreasing red bars, denoting the declining momentum of the sellers in the short-term trading hours.
AUD/JPY hourly chart
(Click on image to enlarge)
In the broader outlook, the AUD/JPY indicates a bullish trend, given its current position above the 20, 100, and 200-day Simple Moving Average (SMA). SMAs serve as technical indicators for analyzing price trends by smoothing out price fluctuations. The pair's stance above all three SMAs suggests a strong stance from the bull in the short and long-term perspectives. In addition, the pair rallying to multi-year highs suggests that the bulls are clearly in command, but traders shouldn't be ruled out as indicators might run out of steam.
AUD/JPY
| OVERVIEW | |
|---|---|
| Today last price | 100.89 |
| Today Daily Change | 0.46 |
| Today Daily Change % | 0.46 |
| Today daily open | 100.43 |
| TRENDS | |
|---|---|
| Daily SMA20 | 99.44 |
| Daily SMA50 | 98.69 |
| Daily SMA100 | 97.69 |
| Daily SMA200 | 96.5 |
| LEVELS | |
|---|---|
| Previous Daily High | 100.45 |
| Previous Daily Low | 99.71 |
| Previous Weekly High | 100.02 |
| Previous Weekly Low | 97.78 |
| Previous Monthly High | 100.17 |
| Previous Monthly Low | 96.9 |
| Daily Fibonacci 38.2% | 100.17 |
| Daily Fibonacci 61.8% | 99.99 |
| Daily Pivot Point S1 | 99.94 |
| Daily Pivot Point S2 | 99.46 |
| Daily Pivot Point S3 | 99.21 |
| Daily Pivot Point R1 | 100.68 |
| Daily Pivot Point R2 | 100.94 |
| Daily Pivot Point R3 | 101.42 |
More By This Author:
Canadian Dollar Recoils On Wednesday, Canada Retail Sales Disappoint
EUR/USD Recovers After US Economic Myth Dented
USD/CAD Price Analysis: Remains Subdued Near 1.3700 As US Dollar Slips


Comments
Log in or sign up to join the conversation.