
A 21 Sigma Move. Happening Right Now.
It starts with a trickle. Then a rush. And then a flood.
That is the pattern of how every major financial bubble burst has occurred, and we're right at the beginning of what looks set to be what we've been calling the opportunity of a lifetime.
Since 2016, we’ve positioned our capital for the next big one. And instead of having to wait as long as us, you probably have the opportunity to make some life-changing gains... in a much shorter timeframe. Let me show you.
A 21 sigma move. Happening right now.
For those of you in the financial world, you'll understand what a 21 sigma move means. For those of you who don't geek out at this all day like us, it means this should NEVER happen. And when it does it means something is seriously wrong.
This is an index showing the relationship between growth stocks and value stocks.
(Click on image to enlarge)
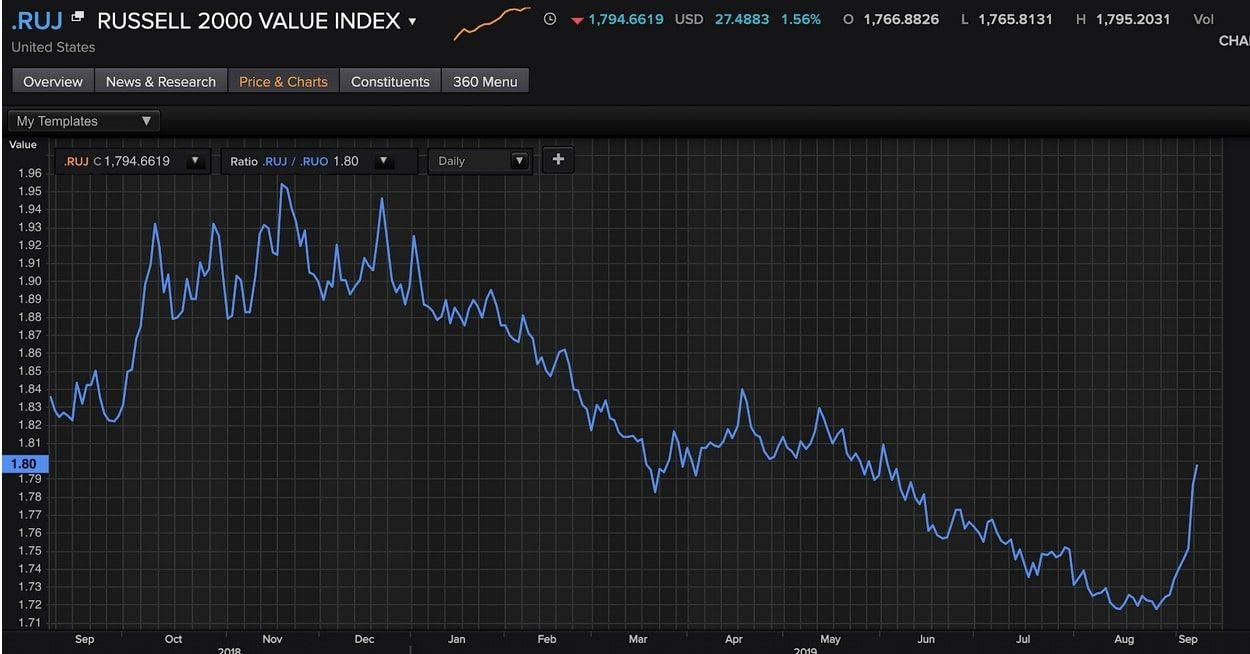
Up until a few weeks ago, growth has massively outperformed value. It’s been one unending trend, set in motion by Central bank initiatives to save the world post 2007/8... Punishing savers and pushing yields into now negative territory.
That is now all changing, and this is worth paying attention to.
Growth stocks are collapsing like a cheap tent, while Value... long beaten and left for dead... just got up out of bed and did some pushups.
And it is just the start.
Now, as exciting as that is let me show you something really sexy. Let me find it. Here it is...
(Click on image to enlarge)
.jpg)
This shows you how cheap (still) value stocks are, despite the trend already shifting.
Even after the powerful move upward in value stocks relative to growth this past week... there is a ton of value (pun intended) to be had.
Folks, we are still at the extreme lows. Extremely oversold offshore oil and gas service stocks have moved violently already. Take a look here.
This is a Paris listed geophysical company, CGG, it’s one of our positions and is up almost 50% in the last 6 months…
Here is the short term 6-month chart.
(Click on image to enlarge)
.jpg)
But really this move is nothing. It is but a blip from a longer-term perspective.
Here’s the long term 10-year chart.
(Click on image to enlarge)
.jpg)
If this reaches its previous highs (or better!) it'll be not too shabby for our subscribers who got in close to the bottom.
Another one of our deep value trades, shipping company Star Bulk Carriers (SBLK), up some 60% over the last 6 months. Once again… the 6-month chart.
(Click on image to enlarge)
.jpg)
And the long term 10-year chart.
(Click on image to enlarge)
.jpg)
The reason we’ve positioned our portfolio in such plays early can be explained with simple math. Take Star Bulk Carriers as an example @ $7 a share.
If it gets to $40 (entirely reasonable in a bull market cycle), that is close to a 500% return.
If you get in now at $11, the return will “only” be 300%.
The above is a glimpse into one area of our portfolio but there is a lot going on. Another sector we've been watching like hawks and positioning our capital for is the breaking of the Sovereign bond bull market. As such I wanted to bring this to your attention;
While value is quite suddenly outperforming growth (to the astonishment of the navel-gazing talking heads in the MSM) this is occurring at the same time that bond markets are selling off violently.
As an example - The Austrian 100yr bond yield moved from 0.60 basis pts to 0.90 basis pts. In other words a mere 30 basis pts, but here’s the part folks will have to be reminded about.
This move equates to a 15% drop in the bond price. A 100 basis pt move would result in a 50% collapse. How does cutting your principal in half feel like with a minuscule 1% move?
THIS my friends is what’s currently considered a “safe haven”.
Nuckin fits, I know.
The Austrian 100yr Bond Price
(Click on image to enlarge)
.jpg)
When I look at something like this I’m reminded of Jim Rogers’ famous line from Market Wizards. Don’t quote me... but it’s something like "the final 50% of the price move often occurs in the last 10% of the period in time".
Oh, and while we’re at it the German 30yr bund dropped by just 15 teensy-weensy little basis pts (a fraction of a percent) and the bond price fell by 6%.
Six percent! On an already negative yield. Yikes.
Remember, every man and his dog is invested in bonds in some way because every asset is priced off bonds in some way.
And if you've got a pension, or your money is being managed by others... chances are, you're deep in bonds... the biggest bubble in the world which looks to be popping in slow-mo.
Never before in our decades of experience professionally managing money for ourselves and others in global markets have we seen such extreme movements and disparities in valuation, from commodity markets, value vs growth, to cyclical vs noncyclical sectors.
What a wonderful time to be alive. It’s truly amazing.
We genuinely believe that it will not be difficult to double our capital in the short term with many of the trades we have been talking about.
In the longer term (5-10 years) it won’t be hard to register 5:1 gains with limited risk of downside.
Even just a small amount allocated to these trades can make a huge difference to the performance of any portfolio over the long term.
Disclaimer: This is not intended to render investment advice. None of the principles of Capex Administrative Ltd or Chris MacIntosh are licensed as financial professionals, brokers, bankers or even ...
more

