
2014 Market Highlights
The two big stories of 2014 were the crash in oil prices and the decline in US interest rates. Both were opposite of consensus expectations.
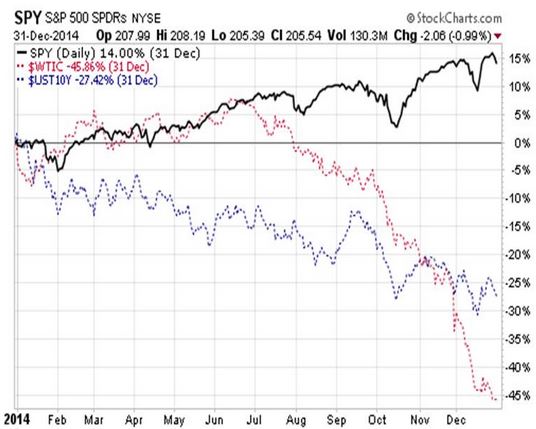
The S&P 500 charged ahead for a 14% gain, but West Texas Intermediate Crude Oil crashed by nearly 46%; and US 10-yr Treasury interest rates declined by over 27% (from 3.00% yield to 2.17% yield)
The price of the 10-yr Treasury bond had a bumpy ride (as the percentage price change chart below shows).

Overall interest rates were down for the year, except for a slight rise in shorter term rates --- the shortest rates being essentially nailed to the floor by the Fed, but the market controlling the intermediate and longer term rates since the Fed stopped buying bonds last October.
This chart shows the yield of all Treasuries along the maturity curve for year-end 2014 in black; and the yield at the start of 2014 in dashed blue. The entire curve shifted down, creating strong gains in bond prices versus the consensus expectation for rates to rise and bond prices to fall. The curve is still steep, which stimulates economic growth.
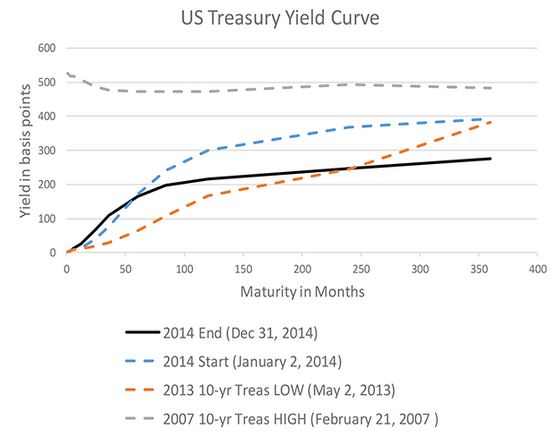
Note the inverted yield curve (dashed gray) for the point in time during 2007 when the 10-year yield was at its peak. An inverted yield curve is when the short-term rates are higher than the long-term rates. That condition is slows the economy and tends to precede a recession. That is a negative sign for stocks when it occurs.
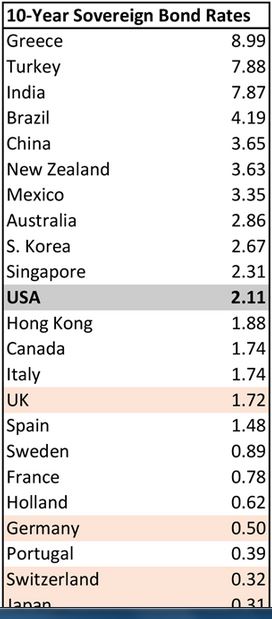
The US Treasury market is still more attractive than other large developed markets capable of absorbing large flows of money, which will tend to moderate the upward movement of Treasury bond yields (prices will have a strong bid), as money migrates our way (particularly if the Dollar remains strong). This table of 10-year sovereign debt yields shows the comparatively attractive US bond market. Given consideration of yield spreads, credit quality, currency trends, and debt market size; the US is a top country.
Looking at six key asset categories, the US stock market (black) and the international developed countries bond markets (purple) were the best performers. US bonds (gold) did fine, but international did better. Emerging market bonds (green) were OK too, but in both the developed international and emerging markets cases, the currency risks were significant.
The developed markets stocks (red) were negative and the emerging markets stocks (blue) were marginally positive

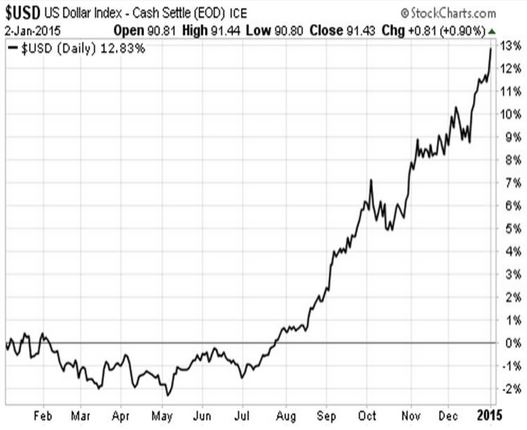
One big factor in the fall in the price of oil (as well as the flat price of gold) was the huge rise in the exchange value of the US Dollar (oil and gold are priced in dollars).
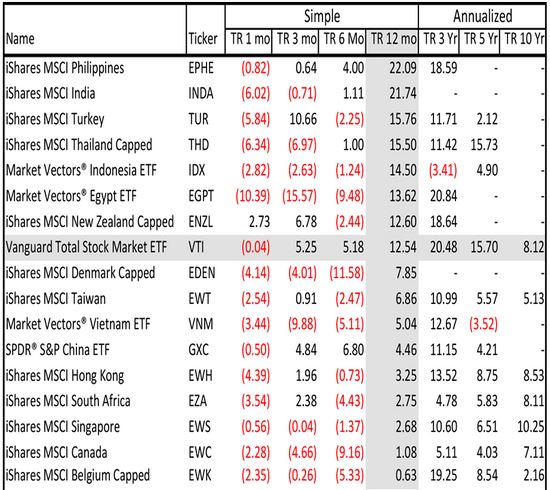
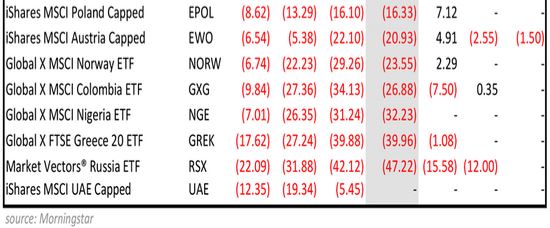
Even though the US stock market was the best among developed markets (with the exception of the tiny New Zealand market), and better than emerging markets in the aggregate, several emerging countries outperformed the US stock market for 2014 as a whole. The Philippines, India, Turkey, Thailand, Indonesia, and Egypt outperformed the US for 2014. Over the less than 1-year period, the US stock market ranked high, but still behind the Philippines an New Zealand.

For 2015, the Fed has announced plans to begin raising the Fed Funds rate (super short-term). We imagine that there may be an initial, short-lived negative stock market reaction to that change, but the yield curve will still be stimulative. We do not expect the Fed action to cause any long-lasting downward stock market movement.
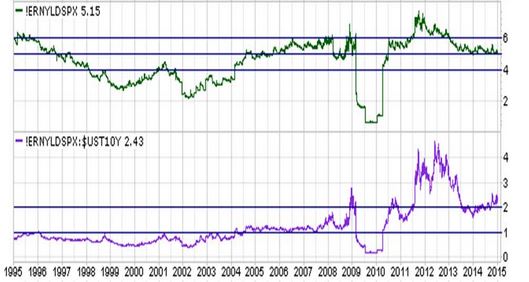
Looking at stocks versus bonds in terms of yields, stocks still look good. S&P 500 reported earnings (green line in main panel) are still growing. The earnings yield [E/P] (green line in middle panel) is 5.15%, which is reasonable in terms of the 20-year history. The earnings yield divided by the 10-year Treasury yield is 2.4x, which makes stocks attractive relative to bonds in terms of the 20-year history. Even if the 10-year Treasury were to rise from its current low 2’s to the mid 3’s, the earnings yield on stocks would still be attractive versus bonds on an historical basis.
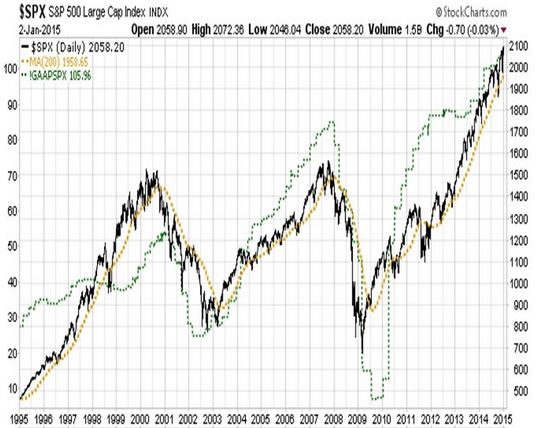
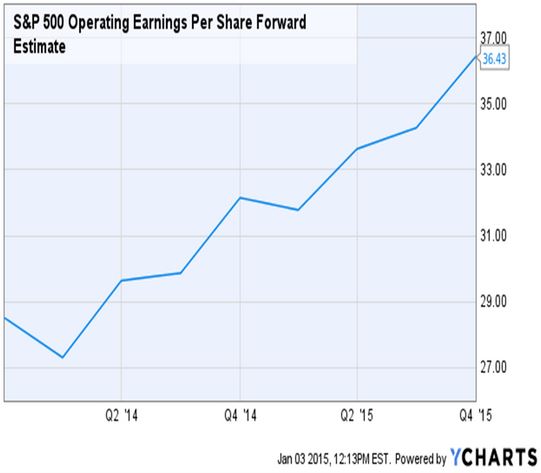
The consensus could be wrong, and left field macro-events could intervene, but at this point, S&P 500 operating earnings are expected to increase in 2015, which would help keep US stock market valuation in reasonable territory. The chart below shows the quarterly forward operating earnings for the S&P 500.
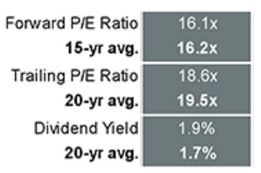
Based on November 30 data, JP Morgan Asset Management shows the forward and trailing P/E ratio (inverse of the Earnings Yield, or E/P) to be generally in line with 15-year and 20-year averages; and the dividend yield to be above normal (also supportive of the current price).
Overall, we are optimistic about USA stocks for 2015; cautious about European stocks due to recession risks and fragility of austerity programs (e.g. Greece potentially violating agreements and others asking why they should perform if Greece does not); unclear about emerging markets; and neutral on bonds.
We don’t expect another year of large capital gains on bonds unless the rest of the world falls apart with a dash to safety in US Treasuries (in which case stock earnings would suffer).
Disclosure: None.
"QVM Invest”, “QVM Research” are service marks of QVM Group LLC. QVM Group LLC is a registered investment advisor.
IMPORTANT NOTE: This report ...
more

