
GDP By State, 2021Q1
BEA released figures Friday. From the release:
Durable goods manufacturing; professional, scientific, and technical services; and information services were the leading contributors to the increase in real GDP nationally (table 2). Accommodation and food services was the leading contributor to the increase in Nevada. Accommodation and food services increased 16.9 percent nationally and contributed to the increases in all 50 states and the District of Columbia.
Other highlights
- Durable goods manufacturing increased 15.6 percent nationally and contributed to the increases in 48 states. This industry was the leading contributor to the increases in 24 states including Utah, the state with the second largest increase.
- Professional, scientific and technical services increased 11.8 percent nationally and contributed to the increases in all 50 states and the District of Columbia. This industry was the leading contributor to the increase in six states and the District of Columbia.
- Information services increased 14.4 percent nationally and contributed to the increases in all 50 states and the District of Columbia. This industry was the leading contributor to the increase in Colorado, the state with the fifth largest increase.
- Nondurable goods manufacturing decreased 4.2 percent nationally. This industry moderated increases in real GDP in 36 states, including Texas, the state with the smallest increase.
Overall, the Nation is close to peak levels recorded in 2019Q4; however, there’s wide variation.
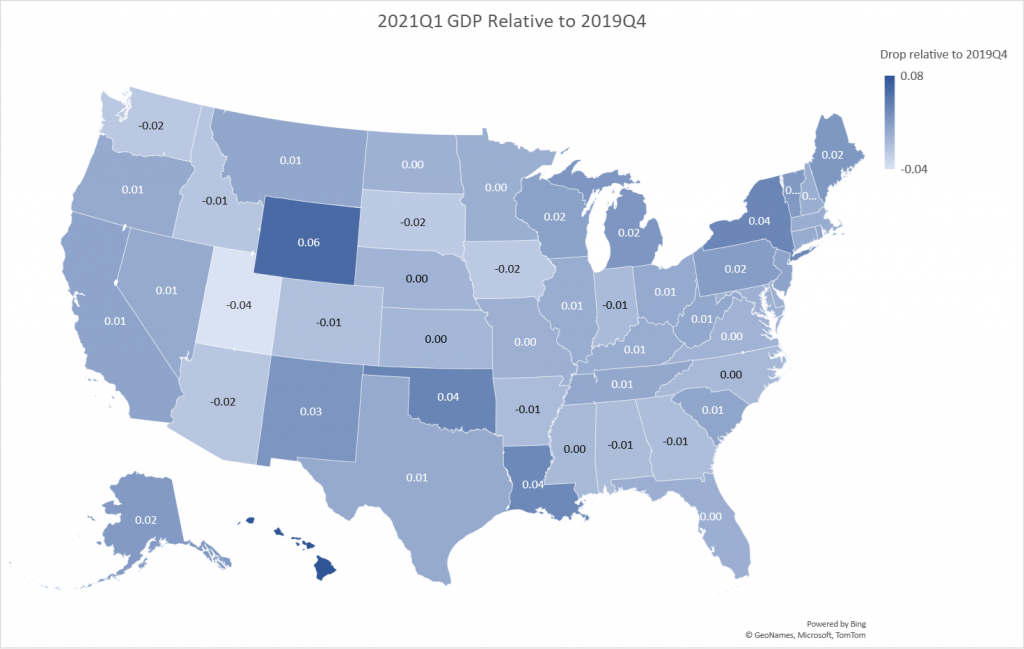
Figure 1: GDP relative to 2019Q4 GDP; darker shading denotes higher ratios. An entry of 0.06 indicates GDP was 6% higher in 2021Q1 than in 2019Q4. Source: BEA, and author’s calculations.
Hawaii is at the top at 7.9%, Utah at the bottom at -3.9%.
Quarter 1 growth rate also varies widely. Below are annualized rates.
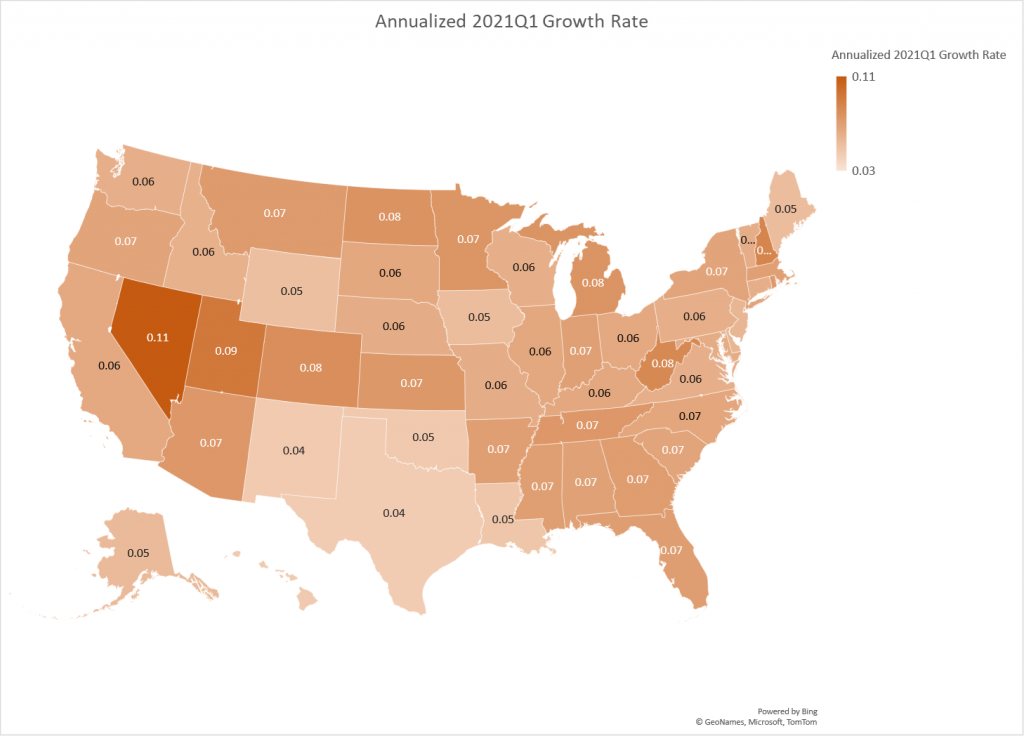
Figure 2: GDP annualized growth rate, 2021Q1. Darker shading denotes faster growth. An entry of 0.11 denotes 11% annualized growth. Source: BEA and author’s calculations.
Fastest growth going from 2020Q4 to 2021Q4 was 10.9% in Nevada, vs. slowest at 2.9% (Washington DC).
How does the recovery correlate with vaccination rate. Below is a map of vaccination rates:
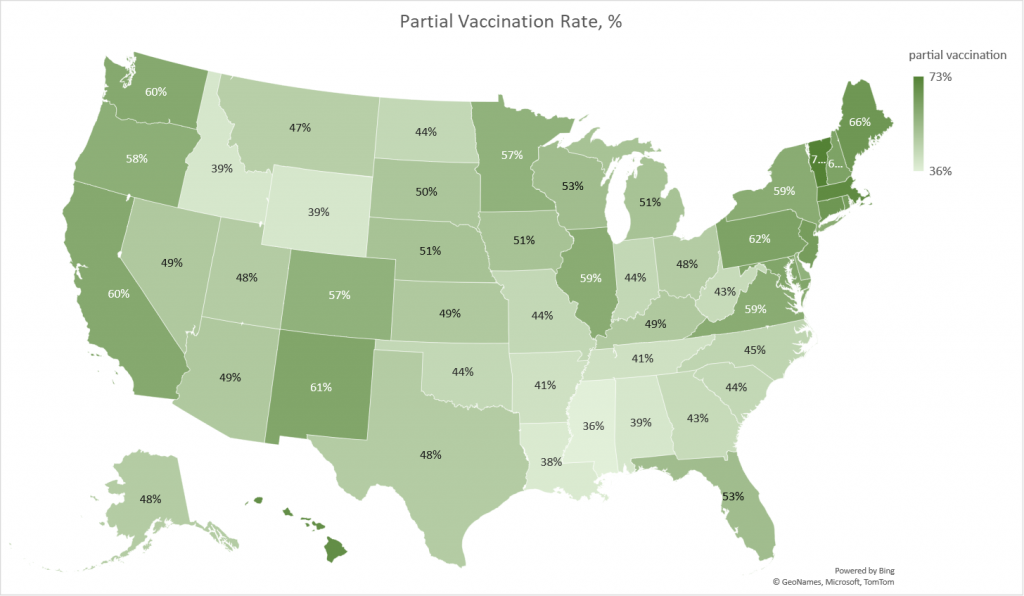
Figure 3: Partial vaccination rates, %. Darker shading denotes higher rates. Source: USAFacts (as of 24 June 2021), and author’s calculations.
Highest partial vaccination rates are in Vermont (73%), and lowest in Mississippi (36%).
As it turns out, a greater degree of recovery is associated with a higher partial vaccination rate (using Q1 GDP, as shown in Figure 1) – and statistically significantly so, using robust regression (slope = 0.056). (Drop outliers in relative GDP Hawaii and Wyoming, and OLS indicates a significantly positive relationship, wherein a one percentage point higher vaccination rate is associated with a 0.05 percentage point higher level of relative GDP).
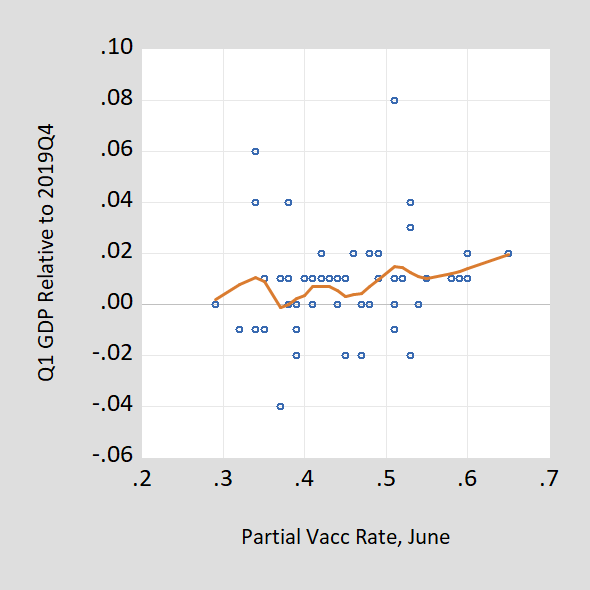
Figure 4: 2021Q1 GDP relative to 2019Q4 versus partial vaccination rate (blue dots), nearest neighbor fit (brown line). Source: BEA, USAFacts (as of 24 June 2021), and author’s calculations.
Obviously, this is in the nature of a correlation; there are no control variables (e.g., structure of economy, initial per capita GDP, etc.), nor accounting for endogeneity. Nonetheless, the fact that the correlation pops up so readily is interesting.
Disclosure: None.


