
GBTC: The 1300 Handle Is Just Around The Corner
As we look at the Grayscale Bitcoin Trust (GBTC), the market closed Friday at $12.59. The Variable Changing Price Momentum Indicator (VC PMI) artificial intelligence identified the average price for next week to be at $12.44. The fact that the market closed above the average price of $12.44 means that it has activated a target above the mean of $12.99. The protective level for this bullish trend momentum is a close below $12.44. A close below $12.44 would negate this bullish trend momentum to neutral and a second close below $12.44 will activate the extreme levels below the mean of $12.04 to $11.50.
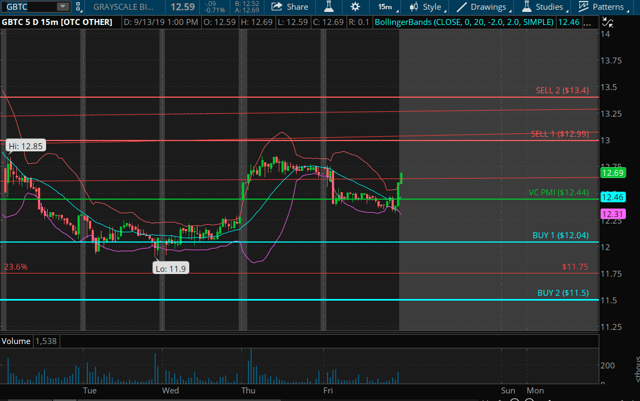
The Sell 1 (S1) level of the extreme above the mean of $12.44 is $12.99 and this level is the relative implied volatility 1:1 ratio to the mean. The automated algorithm has identified that this level has a 90% probability that if the market accomplishes this target, that it will revert back to the mean. The price could reach the Sell 2 (S2) level of $13.40, which has a 95% probability of the market reverting back to the mean, if it reaches that level.
"The VC PMI has identified the distribution levels that we can expect, where we can expect supply or sellers to come into the market," Equity Management Academy CEO Patrick MontesDeOca said. "It is sometimes called resistance."
The VC PMI clearly identifies the areas of supply with precise price levels, unlike other models. The VC PMI also provides trigger points with precise probabilities.
When the market is in the red area, it's at the highest probability of resistance or supply. Even if it activates a sell trigger, there's a 90% or 95% probability that if you buy in that area, you stand a very high chance of losing on the trade. We try to train people to trade the highest probability trades based on the VC PMI and the average price for the coming week.
The VC PMI Automated Algorithm
We use the proprietary Variable Changing Price Momentum Indicator (VC PMI) to analyze the precious metals markets and several indices. The primary driver of the VC PMI is the principle of reversion to the mean ("Mean Reversion Models of Financial Markets," "The Power of Mean Reversion in Factor- Based Investing"), which is combined with a range of analytical tools, including fundamental logic, wav
e counts, Fibonacci ratios, Gann principles, supply and demand levels, pivot points, moving averages and momentum indicators. The science of Vedic mathematics is used to combine these elements into a comprehensive, accurate and highly predictive trading system.
Mean reversion trading seeks to capitalize on extreme changes in the price of a particular security or commodity, based on the assumption that it will revert to its previous state. This theory can be applied to both buying and selling as it allows a trader to profit on unexpected upswings and buy low when an abnormal low occurs. By identifying the average price (the mean) or price equilibrium based on yesterday's supply and demand factors, we can extrapolate the extreme above this average price and the extreme below it. When prices trade at these extreme levels, it's between 90% (Sell 1 or Buy 1 level) and 95% (Sell 2 or Buy 2 level) probable that prices will revert to the mean by the end of the trading session. I use this system to analyze the gold and silver markets.
Strengths And Weaknesses
The main strength of the VC PMI is the ability to identify a specific structure which price level traders can execute with a high degree of accuracy. The program is flexible enough to adjust to market volatility and alerts you when such changes take place, so one can adjust strategies accordingly. Such changes include when the market breaks out of a consolidation phase or a trend accelerates. Such volatility usually happens when the market has produced a signal at the S2 or B2 level and the market closes above or below these extreme levels.
The day trading program then confirms that a higher fractal in price has been identified and the market will move significantly higher, although the same principle applies if the market falls significantly. The price closing above the S2 level indicates that the buying demand is greater than the supply. This means that the market has found support for the next price fractal. Conversely, the price closing below the B2 level indicates that the selling pressure has met demand greater than supply at the extreme below the mean, and prices should revert back to the mean.
The basic concept of the VC PMI is that the program trades the extremes of supply and demand based on the average price daily, weekly and monthly.
The strongest relationship we find in the algorithm is when the daily price is harmonically in alignment with the weekly and monthly indicators. We call this "harmonic timing." Such an indication produces the highest probability (90%) that the price will revert from these levels to its daily, weekly or monthly average.
Disclosure: I am long GBTC.
To learn more about how the VC PMI works and receive weekly reports on the E-mini, gold and silver, check us out on more


