
FOMC Meets Tue; With Leveraged Economy Desperately Needing Low Rates, Fed Cornered
The FOMC meets this week. The Fed already has unlimited QE in place. Not much is expected to come out of this meeting. If anything, aware that low rates are needed, Mr. Powell may drop a hint or two that they are ready to do more if the need be.
(Click on image to enlarge)
A two-day FOMC meeting begins tomorrow. This is the last meeting of 2020 and ends with a press conference by Chair Jerome Powell on Wednesday. Nothing market-moving is expected.
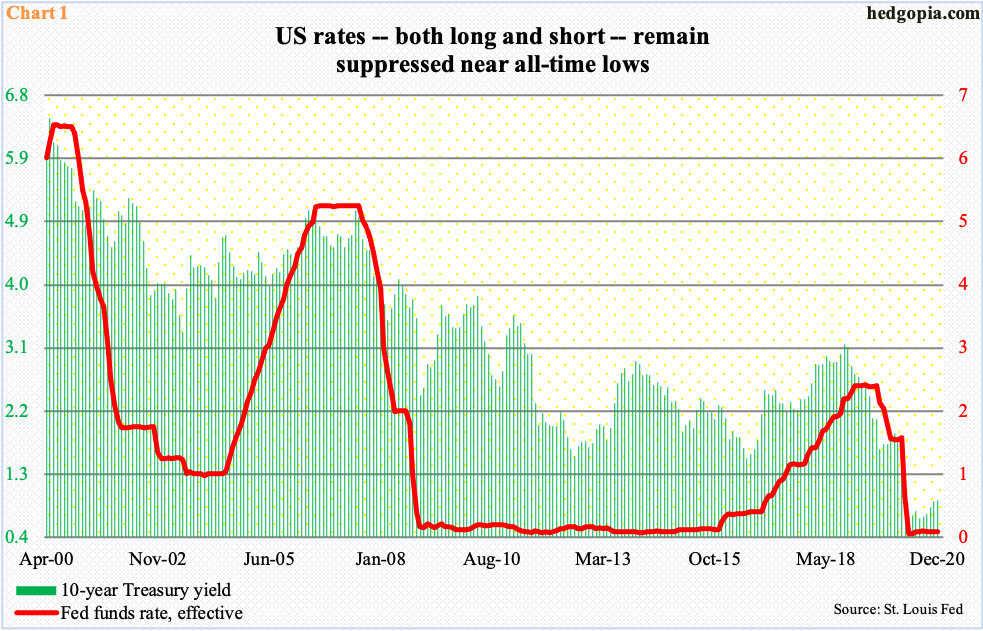
As things stand, both short and long rates are under the Fed’s beck and call. Traditionally, the central bank controls the short end of the yield curve, while the long end is determined by market forces. But because of quantitative easing (QE), they significantly influence – if not control 100 percent – the long end as well. Both the fed funds rate and the 10-year treasury yield remain very accommodative (Chart 1).
The benchmark rate is currently between zero and 25 basis points, while the 10-year yield (0.89 percent) has been under one percent since March.
(Click on image to enlarge)
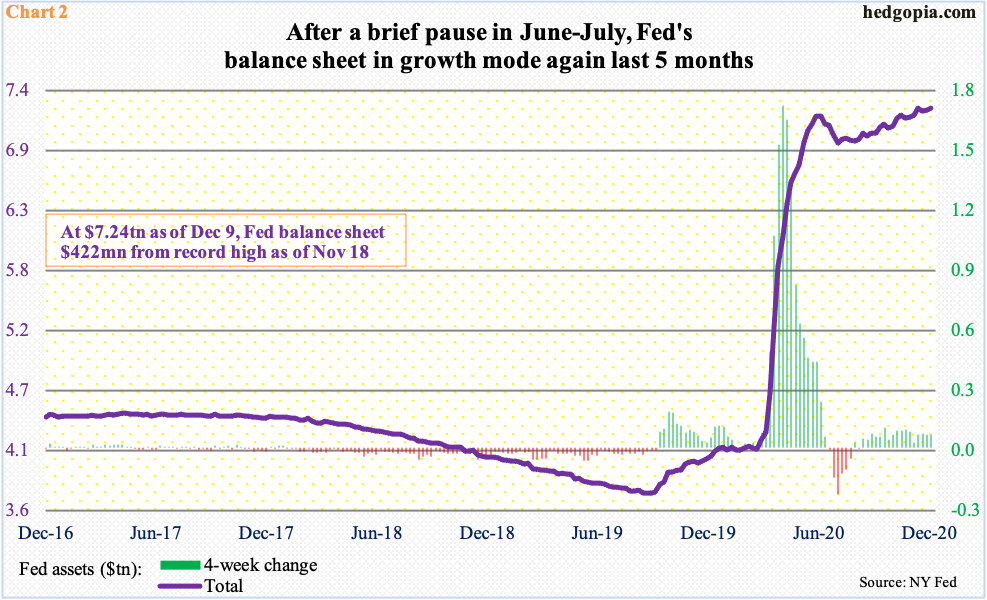
The ultra-accommodative monetary policy comes at a cost. During the financial crisis more than a decade ago, the Fed aggressively expanded its balance sheet. After three iterations of QE, it ballooned to $4.52 trillion by early 2015. By August last year, it contracted to $3.76 trillion, before a new round of expansion began.
After that bottom, the violet line in Chart 2 began trending higher until March this year when it went vertical. That was when the Fed announced unlimited QE and aggressively began buying up assets in order to help an economy that was seriously disrupted by Covid-19. The balance sheet was growing with such ferocity that in one single week in early April it expanded by $1.8 trillion.
By early June, the Fed had accumulated $7.17 trillion in assets, before coming under slight pressure over the next one month. After that brief pause, the trend reasserted itself. Last week, the balance sheet hit $7.24 trillion – merely $422 million from a new high reached three weeks go.
(Click on image to enlarge)
Last month, after Pfizer (PFE) and Moderna (MRNA) delivered positive vaccine news – on the 9th and 16th respectively – US equities rallied huge on optimism the economy begins to get back to normal next year.
Small-caps in particular have been on fire. By nature, they have more domestic exposure than their larger-cap peers which are also internationally exposed.
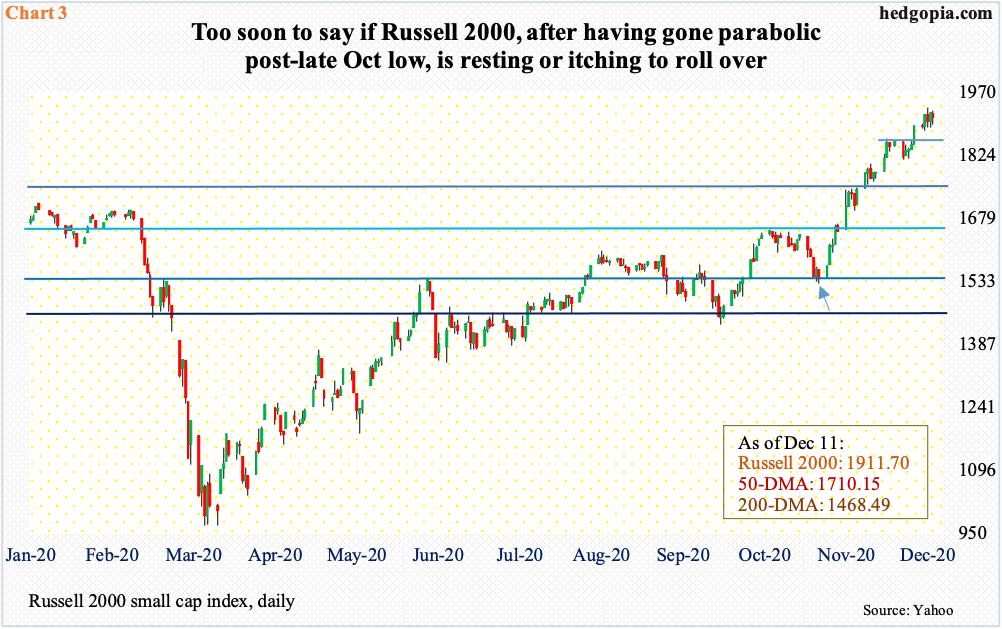
A couple of sessions before the presidential election on November 3, the Russell 2000 defended horizontal support at 1530s (arrow in Chart 3). It then rallied toward major resistance north of 1600 going back to January 2018. On the day the Pfizer news came out, the small cap index blew past this ceiling. A week later, post-Moderna news, it took out its old high from August 2018. Six sessions ago, there was again a mini-breakout – out of 1850s.
Last Wednesday, the Russell 2000 (1911.70) posted a fresh intraday high of 1935.27, but bulls were unable to hang on to the gains. Of late, there are some subtle signs of fatigue, but all week last week bulls defended 1880s.
Near term, 1880s is the one to watch, and 1850s after that. It is only after these two levels are breached do the bears have a shot at 1740s, which bulls will fight tooth and nail to save. What happens around these levels will tell us a lot about how investors perceive the US economy is shaping up.
(Click on image to enlarge)
Chair Powell is not ready to take away the monetary punch bowl just yet. The news from Pfizer and Moderna might mean less monetary stimulus is needed from the Fed. This fear was immediately dispelled.
Speaking at a virtual conference on November 17, Mr. Powell said “widespread vaccination is months into the future.” The US economy is still far from returning to pre-pandemic levels of activity.
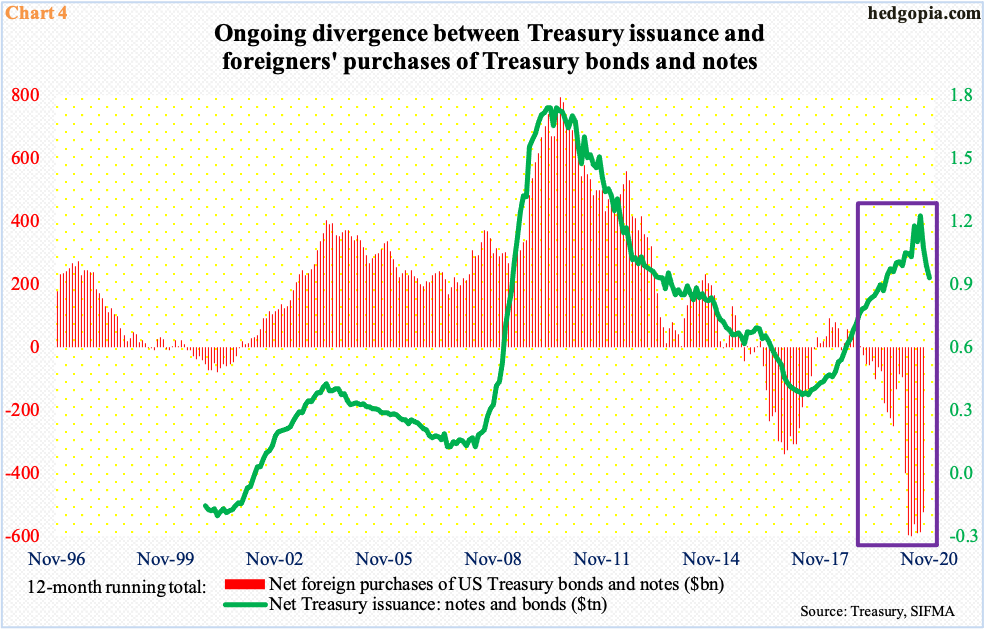
In essence, the Fed is cornered. With the budget deficit hitting the $3-trillion mark, the Treasury is issuing tons of debt. The Fed needs to be there, particularly when foreigners are actively selling treasury notes and bonds. In the 12 months to September, they sold $523.1 billion worth. The all-time high of $600.1 billion was reached in May. Historically, foreigners’ buying – or a lack thereof – tends to move hand in hand with treasury issuance. Not this time (Chart 4).
(Click on image to enlarge)
A mismatch between supply and demand is a recipe for higher rates, which the Fed cannot allow to happen. The debt load is simply too high throughout the economy – be it household, corporate or federal.
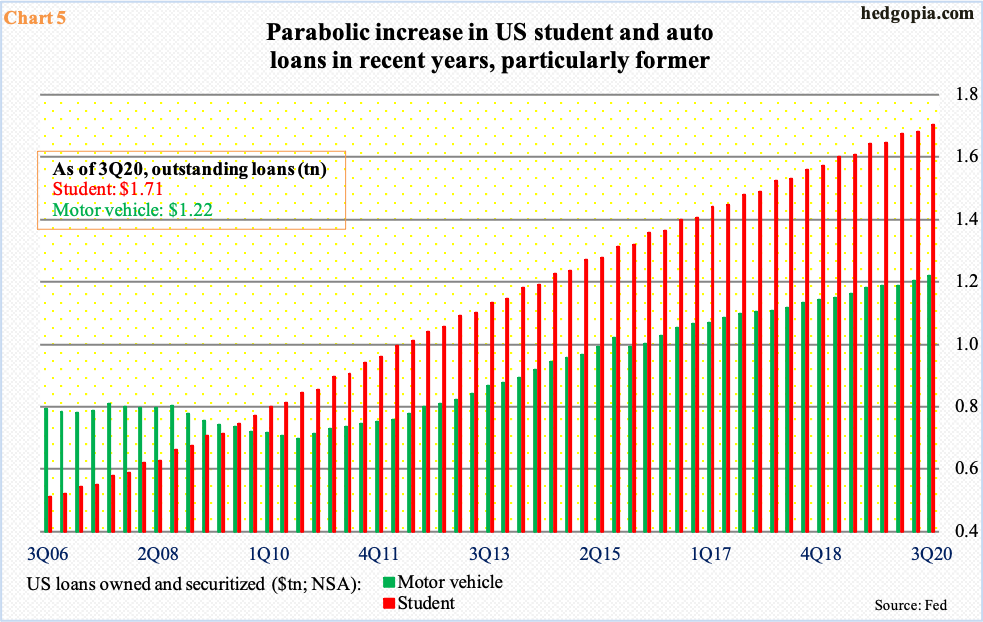
Households owe north of $16 trillion, of which mortgage-related is nearly $11 trillion and consumer credit $4.1 trillion. To get an idea about how the debt culture has progressed over the years, student and auto loans serve as the best example.
As of 3Q, student loans stood at $1.7 trillion and auto loans at $1.2 trillion. The bars in Chart 5 have steadily gone from the lower left to the upper right. The trend is going in the wrong direction.
(Click on image to enlarge)
This is true in the corporate world as well.
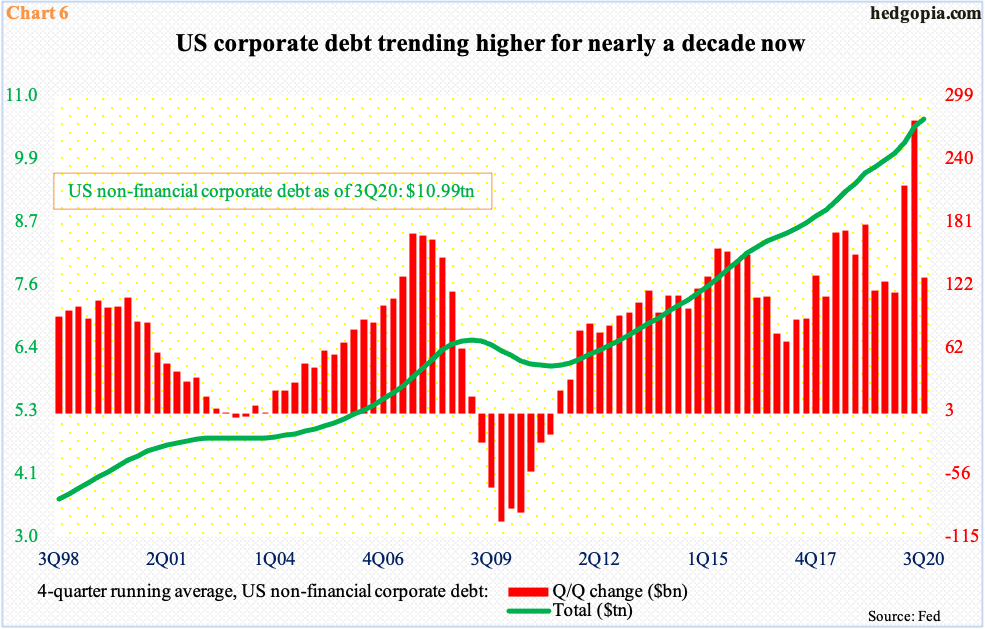
As of 2Q20, corporate debt totaled $11 trillion. Chart 6 uses the four-quarter running average, and once again, the trend is from the lower left to the upper right.
In March, the Fed announced it would begin to buy US investment-grade corporate bonds, which in April was expanded to also include junk bonds. This literally lit a fire under these securities. In the first 11 months this year, corporate bond issuance totaled $2.20 trillion, made up of $1.81 trillion in investment-grade and $389.6 billion in high-grade. All three categories have already made new records, massively surpassing the prior total of $1.64 trillion in 2017 (chart here).
(Click on image to enlarge)
The federal government is not far behind.
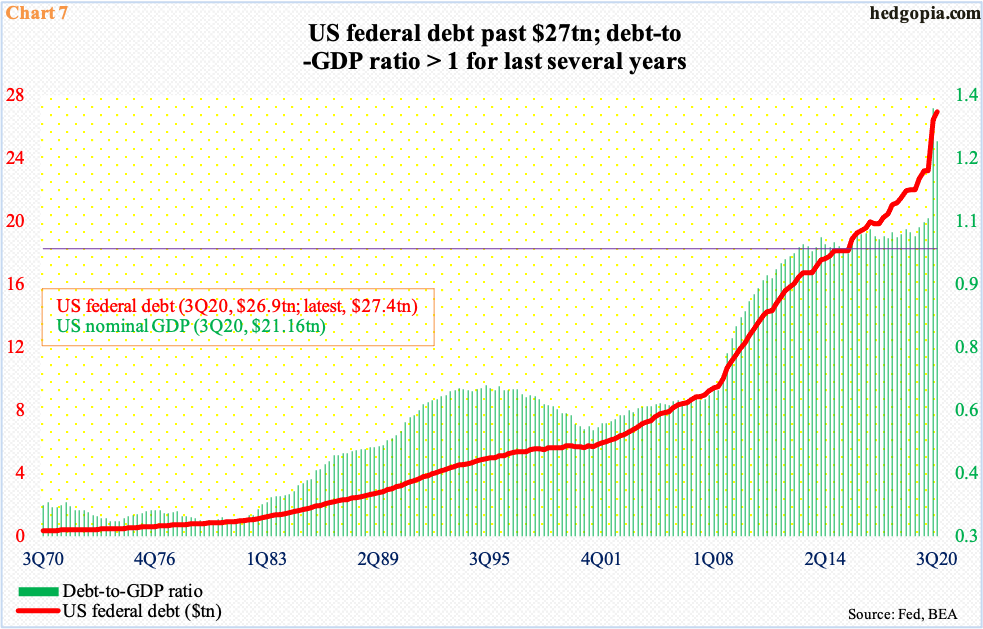
The US national debt is nearing $27.5 trillion. At the end of last year, this was $23.2 trillion, and $11.5 trillion when Great Recession ended in 2Q09, meaning the debt pile continued to grow all through the longest expansion in US history which came to an end in January this year.
The last time the debt-to-GDP ratio crossed one was in 4Q12. Since then, barring three quarters which too were pretty close to unity, the ratio has persistently shown debt in excess of nominal GDP. In 3Q20, debt was $26.9 trillion and GDP $21.2 trillion.
(Click on image to enlarge)
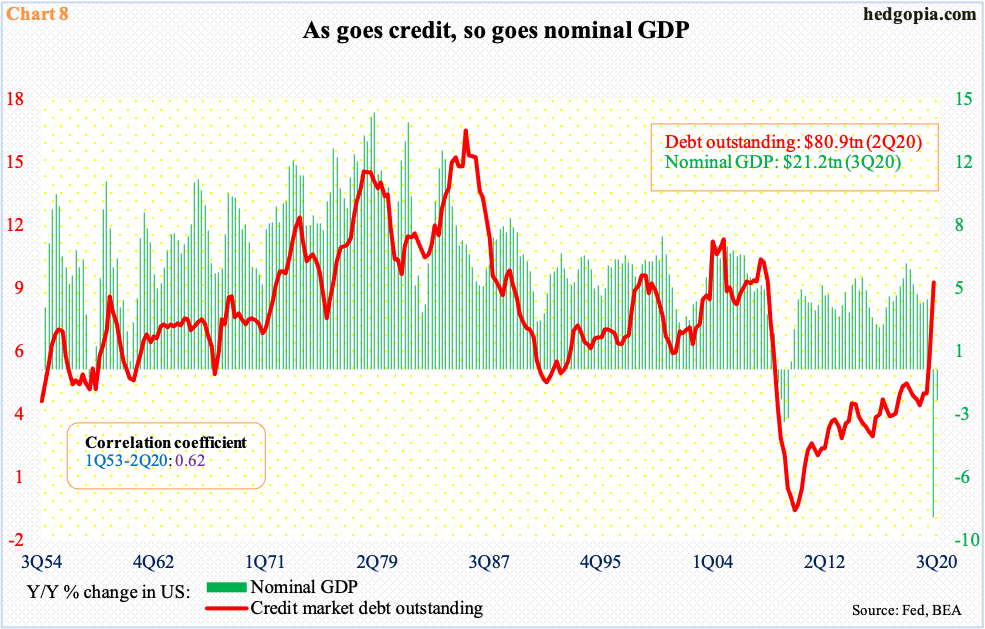
The irony in all this is that the reliance on leverage has grown to a level where it holds tight relationship with GDP (Chart 8). The economy needs debt to sustain growth. There are no two ways about it. Low rates will help.
In recent months, there has been some softening in economic data. For a while now, Fed officials have stressed the need for fiscal stimulus, but Congress cannot seem to agree on a new spending bill. Should he so desire, Mr. Powell can use this as an excuse to sound more dovish on Wednesday. Across the pond, the ECB last Thursday announced further asset purchases, adding another €500 billion to its €1.35-trillion emergency bond-buying program and extending it to March 2022. The US already has open-ended QE in place, so the Fed has to get extra creative – either now or later – to please markets addicted on monetary morphine.


