
Five Observations On The Employment Release
1.The deceleration in employment growth is noticeable; 2. Taken with the preliminary benchmark revision, it’s possible employment growth deceleration is even more marked; 3. With accounting for temporary census workers, m/m growth is fairly anemic; 4. Nonetheless, latest vintages of key indicators suggest only a slowdown; 5. Manufacturing employment and hours (as well as production) still below peak.
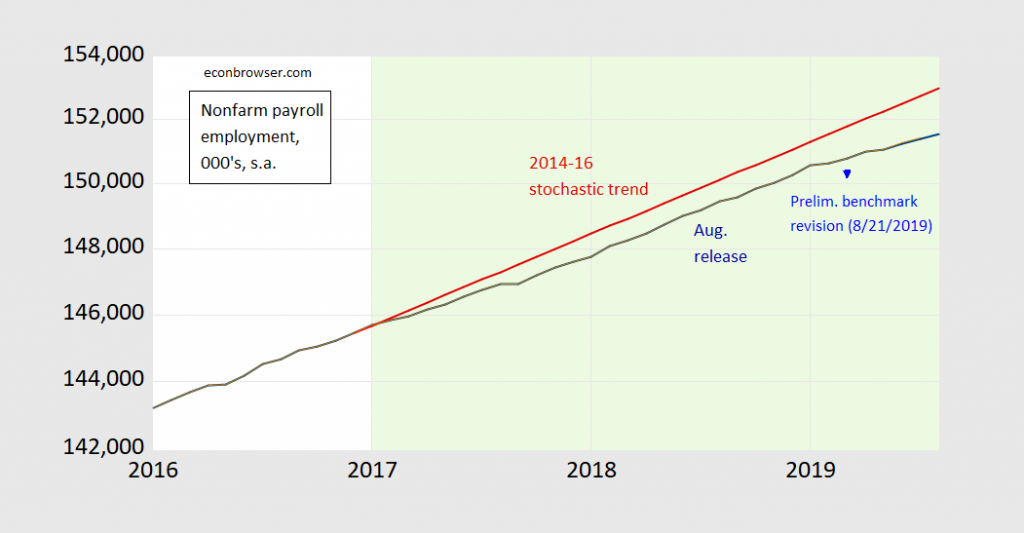
Figure 1: Nonfarm payroll employment, latest vintage (dark blue), 2014-2016 stochastic trend (red), and March preliminary benchmark revision (blue triangle). Light green denotes Trump administration. Source: BLS and author’s calculations.
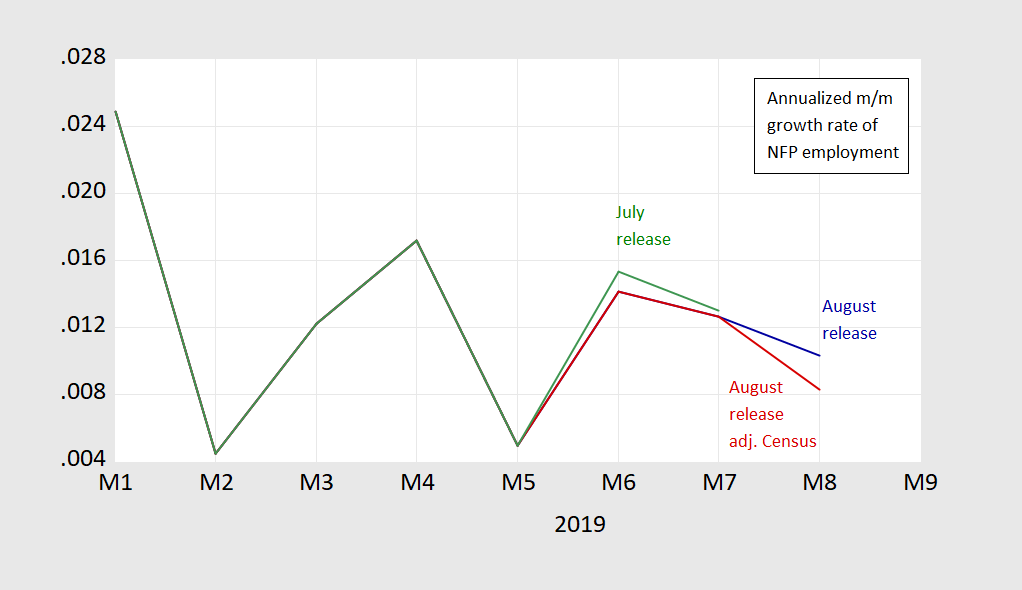
Figure 2: Month-on-month annualized growth in nonfarm payroll employment, latest vintage (dark blue), in July release (green), and in latest vintage deducting 25,000 temporary Census workers in August (dark red). Growth rates calculated as first log differences. Source: BLS and author’s calculations.
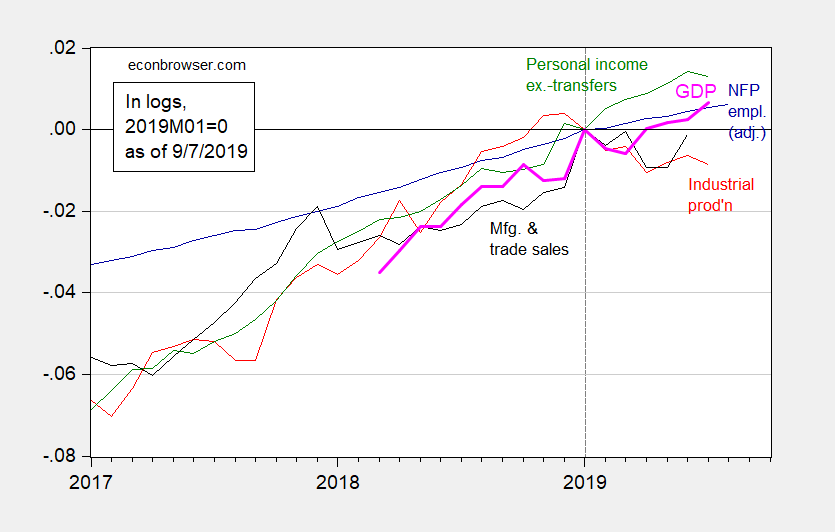
Figure 3: Nonfarm payroll employment (blue), industrial production (red), personal income excluding current transfers (green), manufacturing and trade sales (black), and monthly GDP (pink), all in logs, normalized to 2019M01=0. Source: BLS, Federal Reserve Board, BEA via FRED, Macroeconomic Advisers (29 August 2019), and author’s calculations.
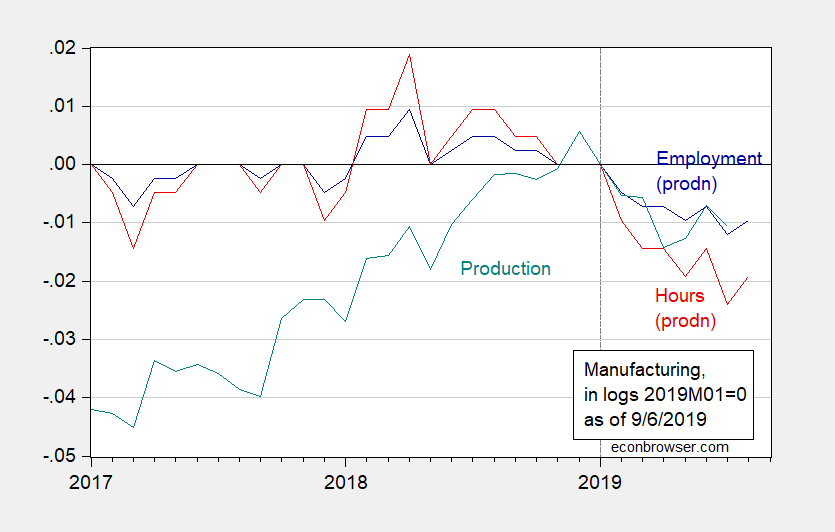
Figure 4: Employment in manufacturing (blue), aggregate hours of nonsupervisory and production workers in manufacturing (teal), and manufacturing production (red), all in logs, 2019M01=0. Source: BLS, Federal Reserve via FRED, and author’s calculations.
Disclosure: None.


