
Is The Ethereum Correction Done? Here Is What The Charts Are Signaling

Image Source: Pixabay
Ethereum (ETH-X) had a terrific year so far – the price rose more than five times, outperforming Bitcoin (BITCOMP). Recent news that a new COVID-19 variant threatens the progress made so far during the pandemic has sent financial markets lower. Ethereum fell to a major support area, but will it hold?
Ethereum is one of the cryptocurrencies that outperformed this year. Its price rose more than five times so far in the year, as cryptocurrencies have grown in popularity. It outperformed Bitcoin, and not only by how much it rose in 2021. It also outperforms Bitcoin and other cryptocurrencies in the number of daily transactions taking place on the Ethereum network.
For example, in 2016, Bitcoin led the way in the number of daily transactions – 224 thousand compared to 17 thousand for Ethereum and 5 thousand for Litecoin (LTC-X). Fast forward to September 2021, and the number of daily transactions with Bitcoin remains more or less the same, at 232 thousand. However, there are 1.2 million Ethereum daily transactions, partly explaining the price performance in 2021 as it has increased in popularity.
One of the reasons for the increase in popularity is the smart contract functionality, due to which Ethereum has attracted a large among of decentralized applications and transactions. What comes next for Ethereum, now that it has met horizontal support? In the grand scheme of things, conditions are still bullish.
Ethereum meets dynamic support as bullish conditions hold
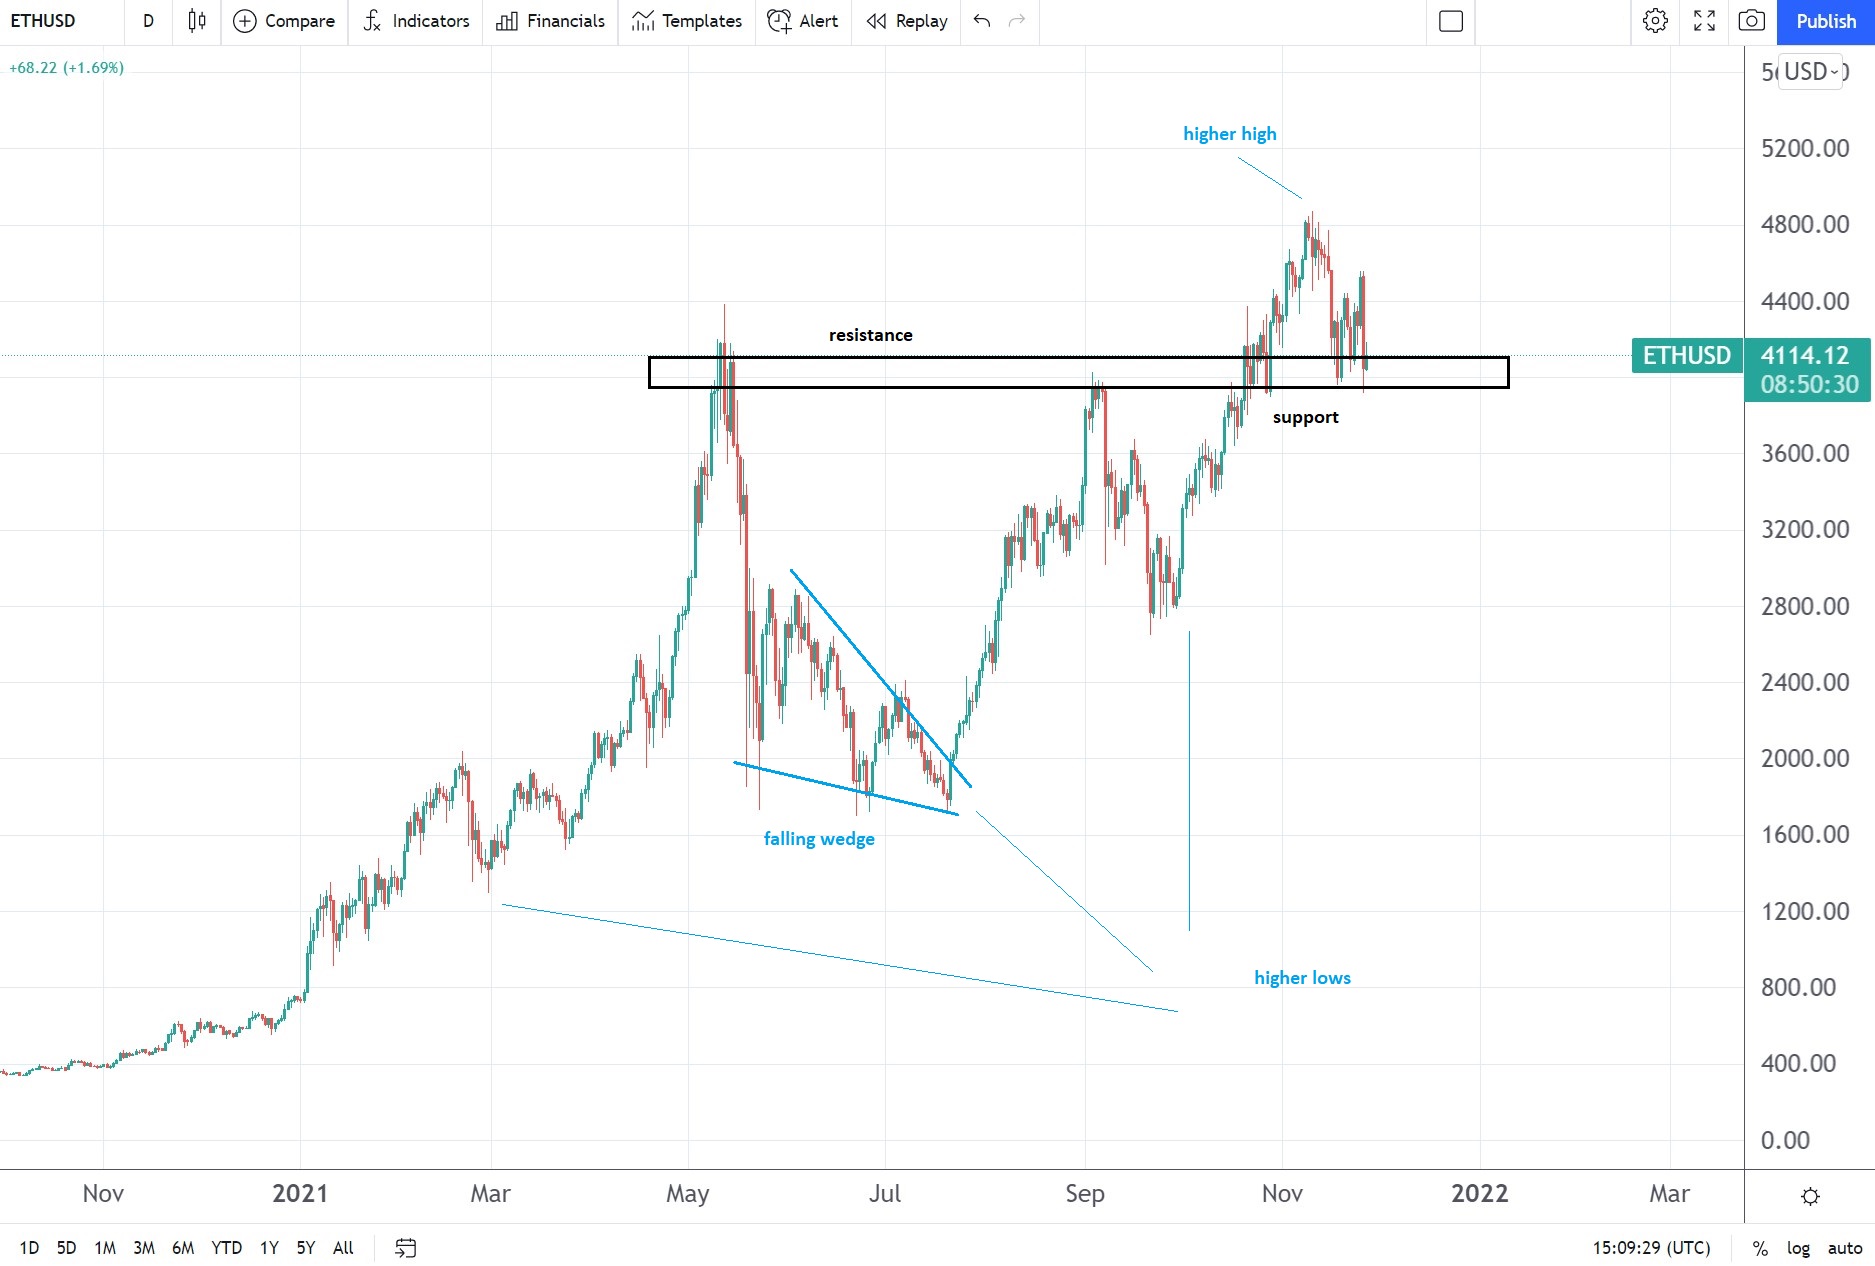
From left to right, the chart above tells the story of a bullish market. It all started with Ethereum breaking above $1,000 – a major milestone and an inflection point. After that, the price action formed a series of higher highs and higher lows, confirming the bullish market. The price exceeded $4,000 in May before correcting with the entire cryptocurrency market.
During the summer months, a huge falling wedge pattern became visible on the daily chart. Naturally, the price broke higher because a falling wedge is a bullish pattern. After that, the market met resistance in the $4,000 for the second time. Eventually, resistance was cleared, and it turned into support.
Support may or may not hold, but even if it doesn’t, only a drop below 2,800 will invalidate the bullish case. It is at that point that the higher lows series would be invalidated.
Disclaimer: None of the content in this article should be viewed as investment advice or a recommendation to buy or sell. Past performance/statistics may not necessarily reflect future ...
more

