
Bitcoin Blasts Off, But Will The Rest Of The Crypto Market Soon Follow?

Bitcoin (BITCOMP) broke out above resistance to a five-month high, but most leading altcoins remain stuck in a range. Will they catch up? The Bitcoin Dominance Index is a powerful indicator that may yield the answer. Here’s how it works.
In our Oct. 1 post, we shared the chart below to show how Bitcoin kicked off the month by breaking out above several resistance levels.
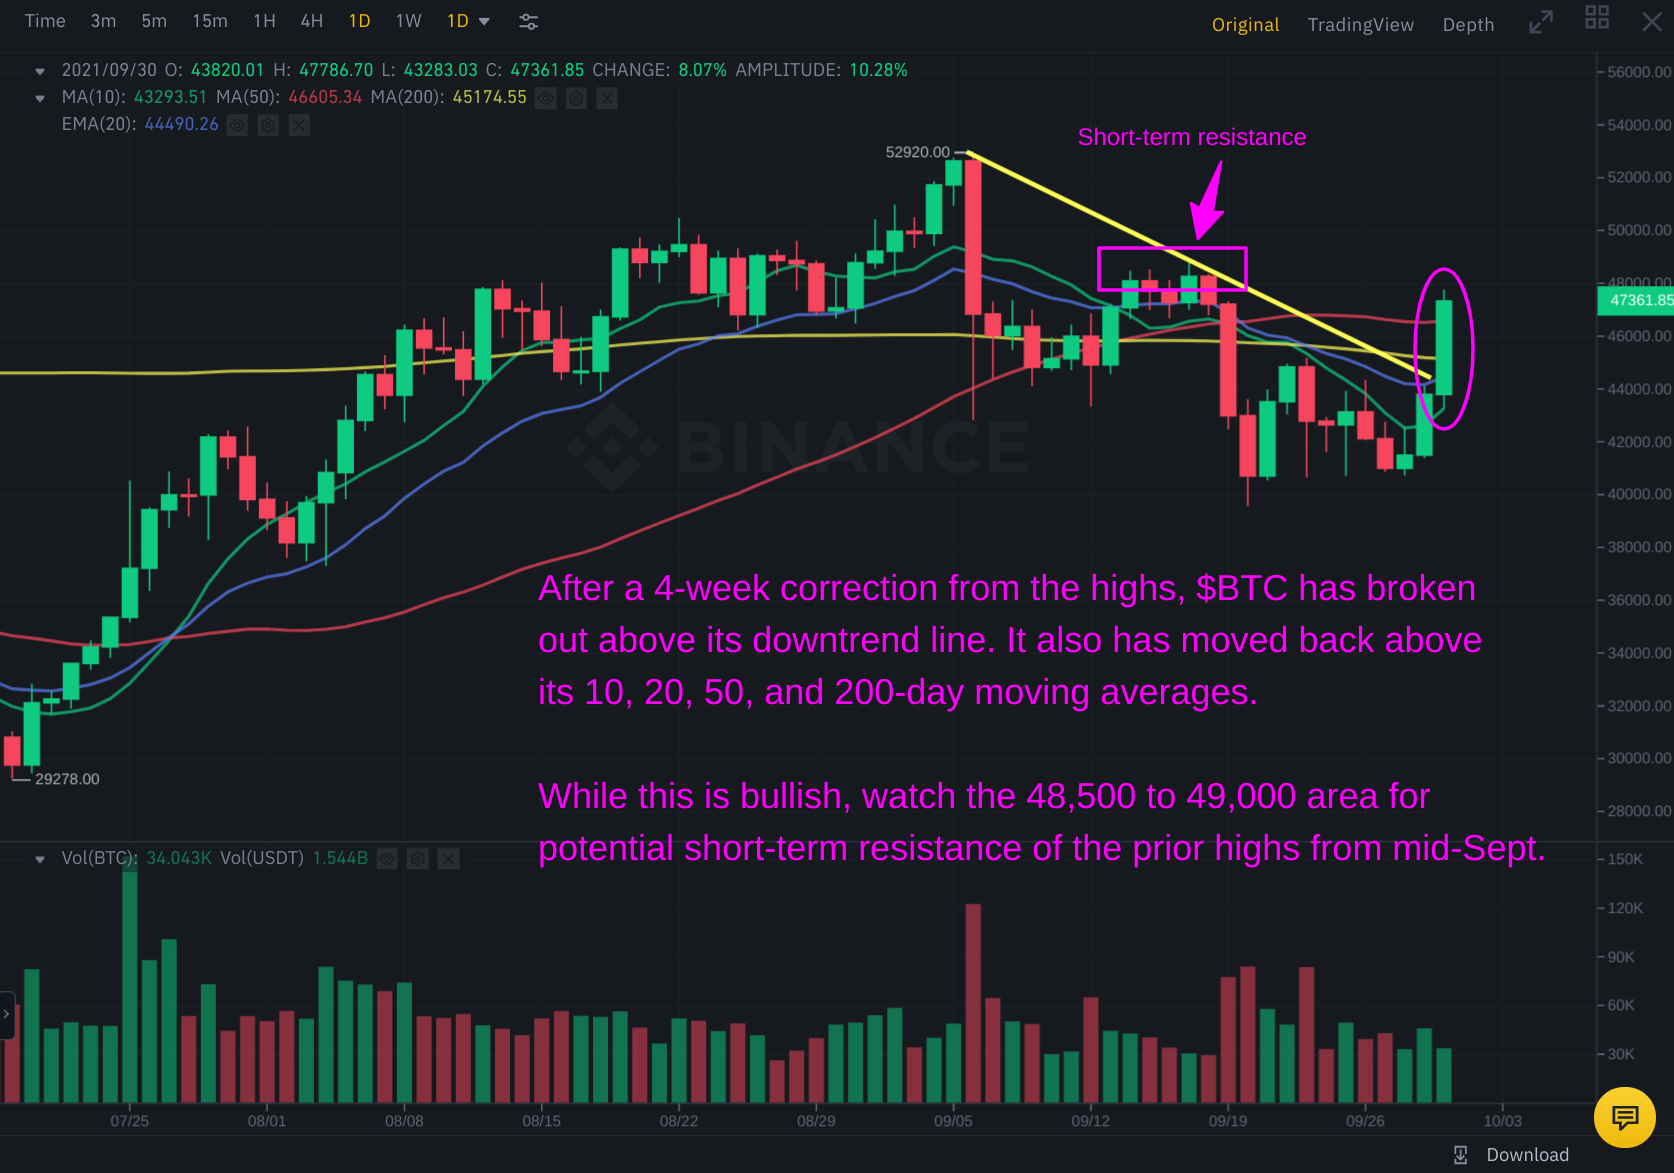
We then said, “Short-term overhead resistance may be found in the $48,500 to $49,000 range (prior highs from mid-September), which could lead to a bit of price consolidation or pullback.” As anticipated, BTC indeed consolidated in a tight range for several days after testing resistance of its mid-September high.
However, the bulls quickly returned to propel Bitcoin all the way above the highs of last month’s pullback. That Oct. 5 breakout above the prior September highs was quite powerful because it caused BTC to also break out from a bullish pennant pattern on the longer-term weekly chart timeframe.
The pennant breakout and key support and resistance levels to monitor are annotated on the weekly chart below.
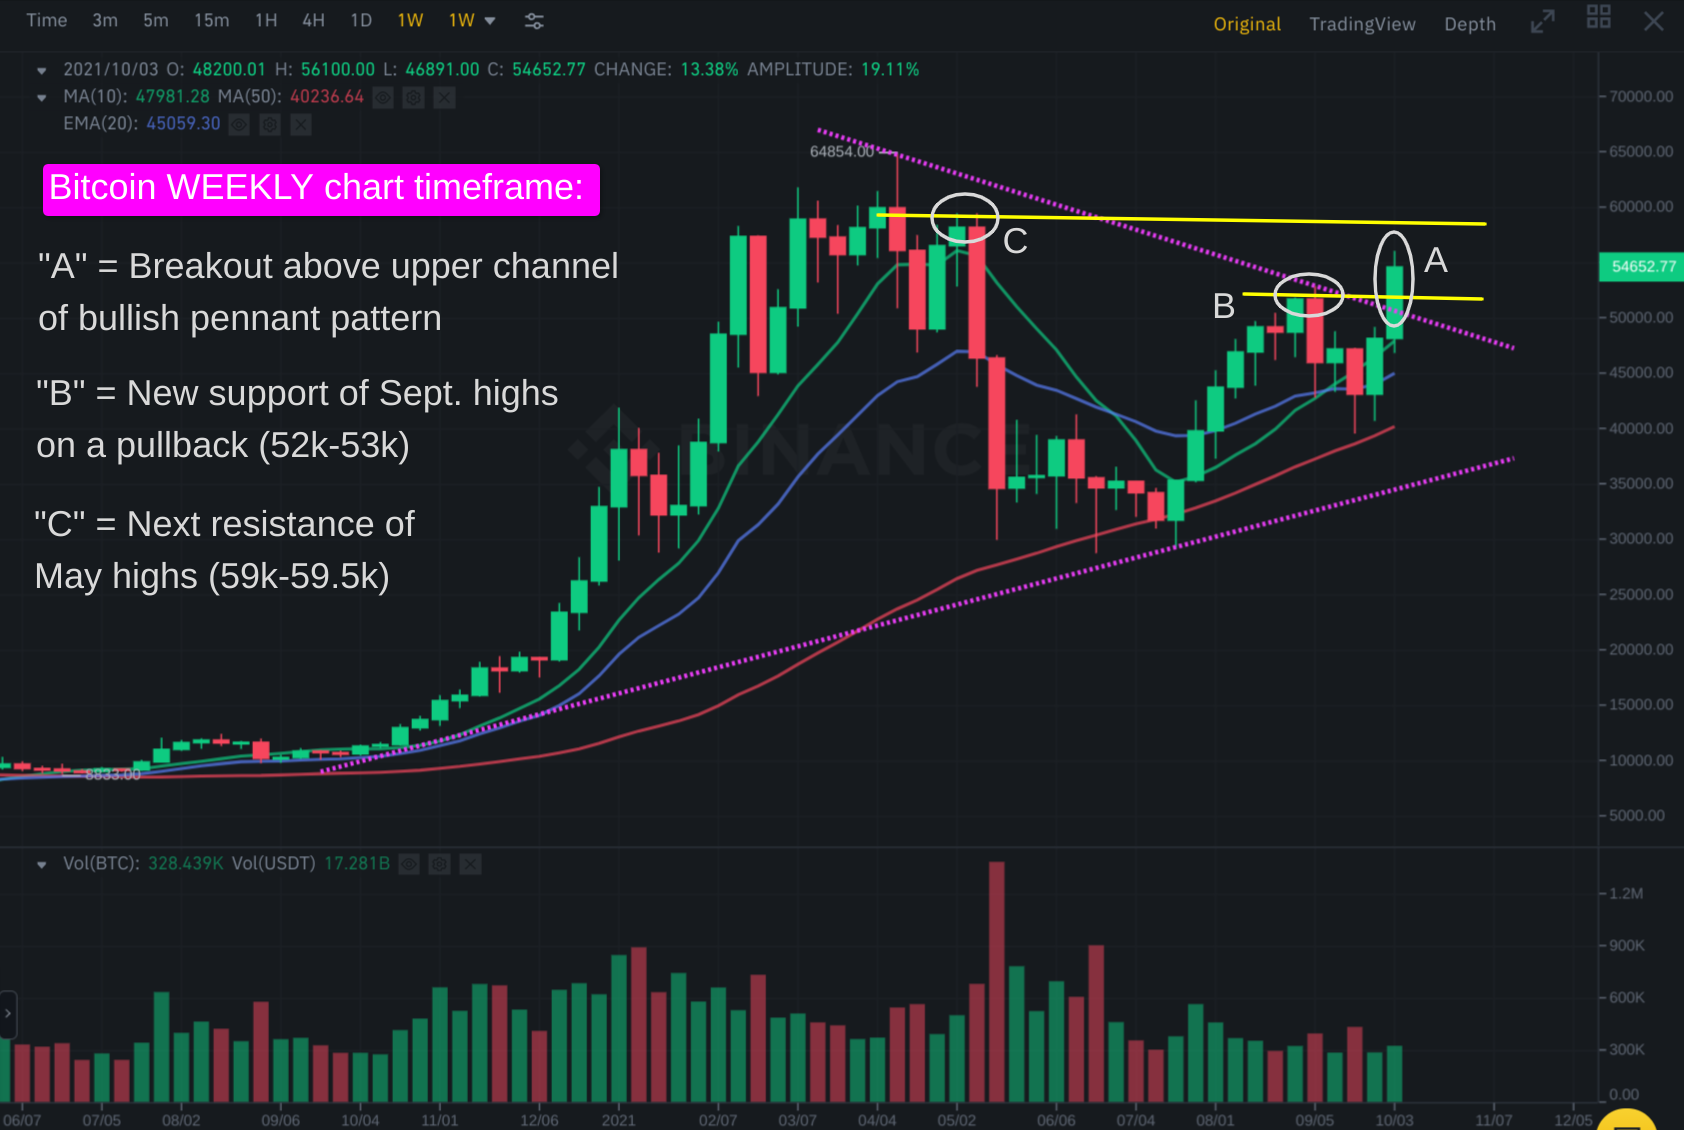
Recently, Bitcoin has been consolidating in a tight, sideways range for the past three days since breaking out above resistance of its September high (“B”).
If the bullish, short-term consolidation follows through with another breakout above the current range highs (56,000 area), then watch for a potential BTC pullback at next resistance of the 59,000-59,500 area (“C”). In case of any near-term selling pressure, look for a BTC shakeout to find support in the 52,000-53,000 area (“B”).
Bitcoin’s short-term price action and volume pattern of the past week has been firmly bullish overall. Drilling down to the four-hour timeframe, just look at how smoothly Bitcoin has been trending higher since the initial Oct. 1 breakout.
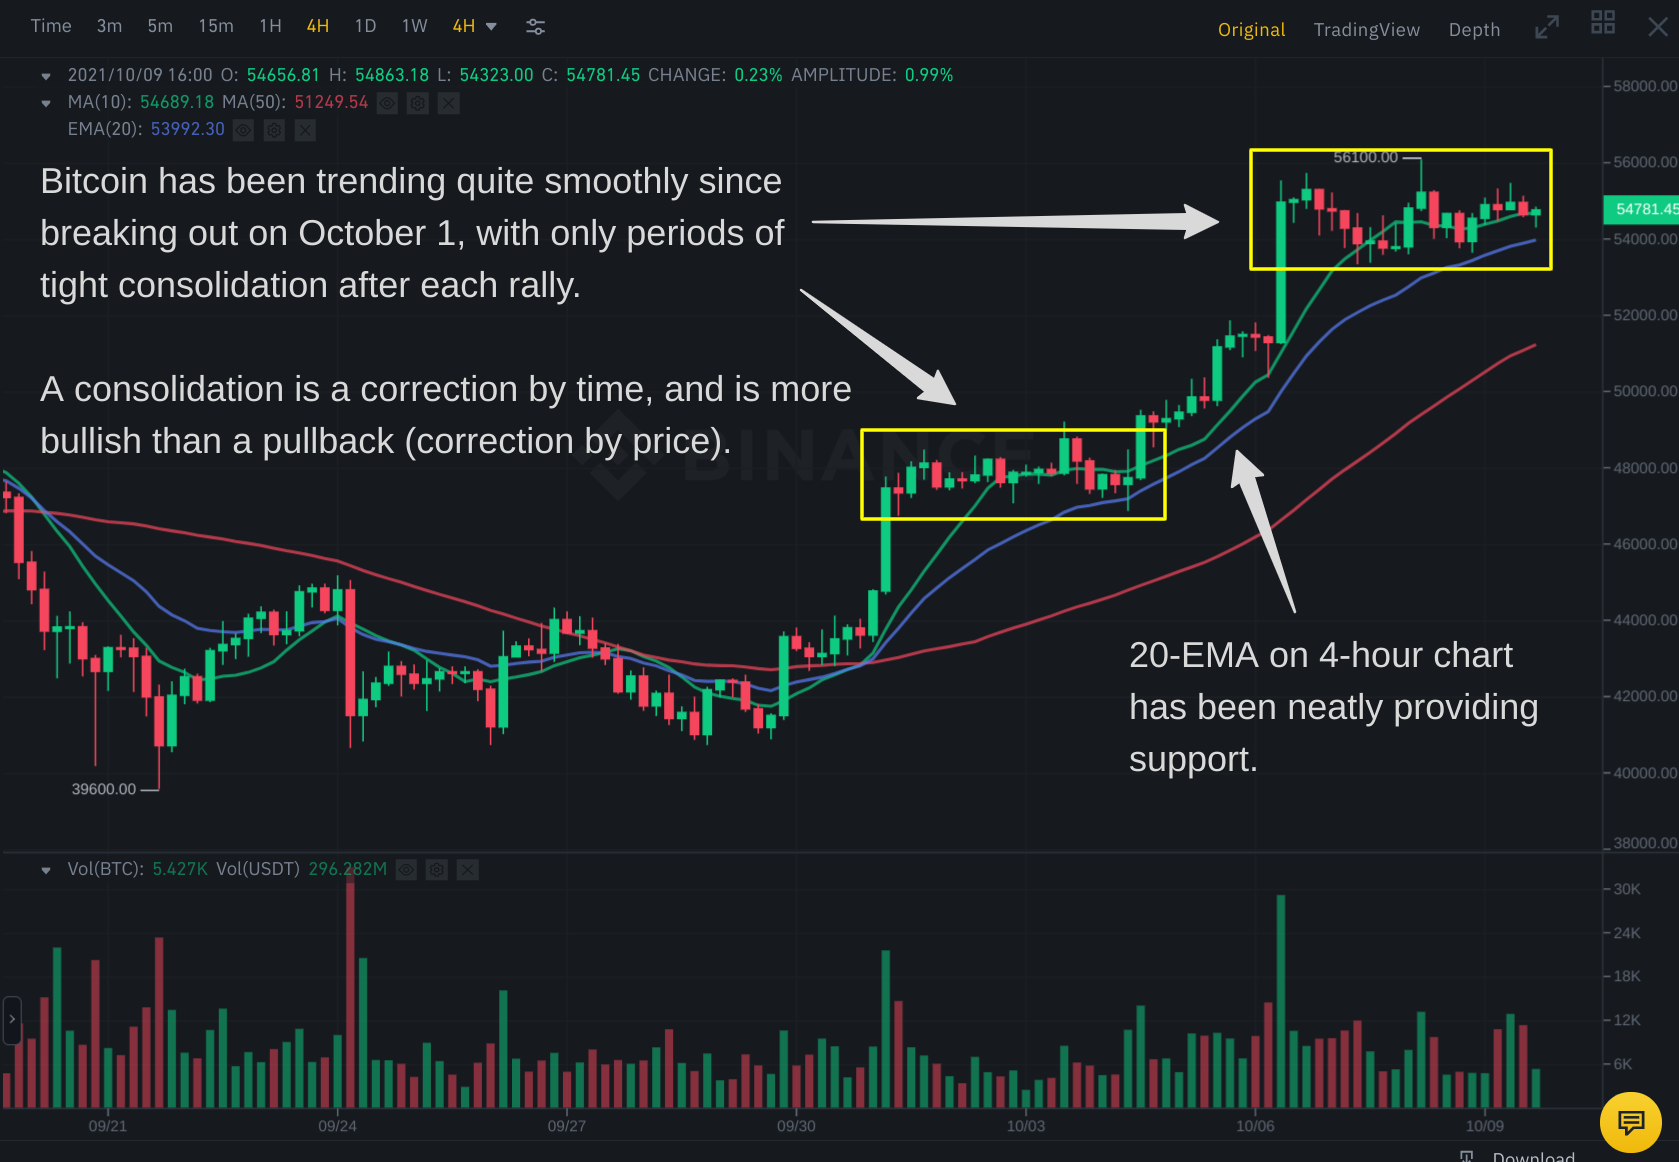
The chart above is a great example of why we frequently mention that cryptocurrency usually follows the rules of technical analysis and trends very nicely.
Bitcoin as a Crypto Market Proxy
The S&P 500 and Nasdaq Composite indexes are popular market proxies that show the general health of the U.S. stock markets. Similar benchmark indexes do not yet exist in cryptoland, but the performance of BTC itself is currently a market proxy for the overall cryptocurrency market. For example, a majority of the nearly 10,000 crypto altcoins trend higher when Bitcoin is in a bull market, and lower when BTC is in a bear market.
This is why we regularly analyze the charts of Bitcoin–even though we trade leading altcoins more than BTC itself. Still, a strong Bitcoin trend does not mean that the altcoin market is automatically leading with massive gains. Rather, there is another crucial indicator (nearly as important as Bitcoin’s trend) we follow to assess the overall altcoin market trend.
Pay careful attention to the next section because understanding this key indicator will surely have a direct impact on your overall crypto trading profitability.
The Secret Sauce: Bitcoin Dominance Index
When I first began trading cryptocurrencies many years ago, I assumed that most altcoins would automatically move lower when Bitcoin sold off and higher when it rallied. I was only partially correct.
Most altcoins will indeed move lower if Bitcoin is in a downtrend. But this does not mean the altcoin market will automatically move higher if Bitcoin is rallying. Rather, it depends on the current flow of funds that comprise the total 2.4 trillion dollar crypto market.
Investors are sometimes more focused on buying altcoins–which have the potential for huge gains, but higher volatility and perceived risk. But sometimes the market is more focused on primarily buying Bitcoin itself. When investors rotate their crypto funds from Bitcoin to altcoins, it means that BTC will comprise a smaller percentage of the overall crypto market cap.
Conversely, the percentage weighting of Bitcoin (compared to total crypto market cap) increases when funds are rotated from altcoins back to Bitcoin. Our job as short to intermediate-term swing traders is simply to identify and follow that money flow, then position our portfolio accordingly.
Following the Bitcoin Dominance Index is an easy and reliable way to do so. The Bitcoin Dominance Index simply measures how much of the total market cap of all cryptos is comprised solely of Bitcoin.
When the Dominance Index is rising, it means altcoins overall are losing value versus Bitcoin. When the index is falling, the altcoin market is gaining value versus BTC. Check out the current weekly chart of the Dominance Index below.
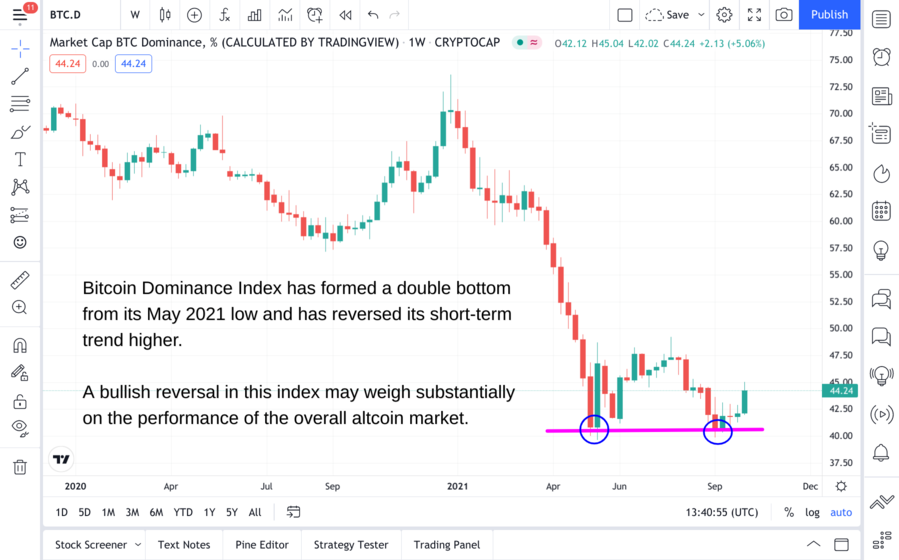
The Bitcoin Dominance Index was trending steadily lower until it found a bottom in May. Bitcoin started re-gaining dominance as the market entered correction mode from May through July. Funds flowed into altcoins when the bulls returned in late July, causing the index to drift back down to its May lows.
But now we’ve got a double bottom at the May lows, which coincides with the recent rally in Bitcoin. Drilling down to the four-hour chart, it becomes apparent the short-term trend of the Dominance Index has reversed higher.
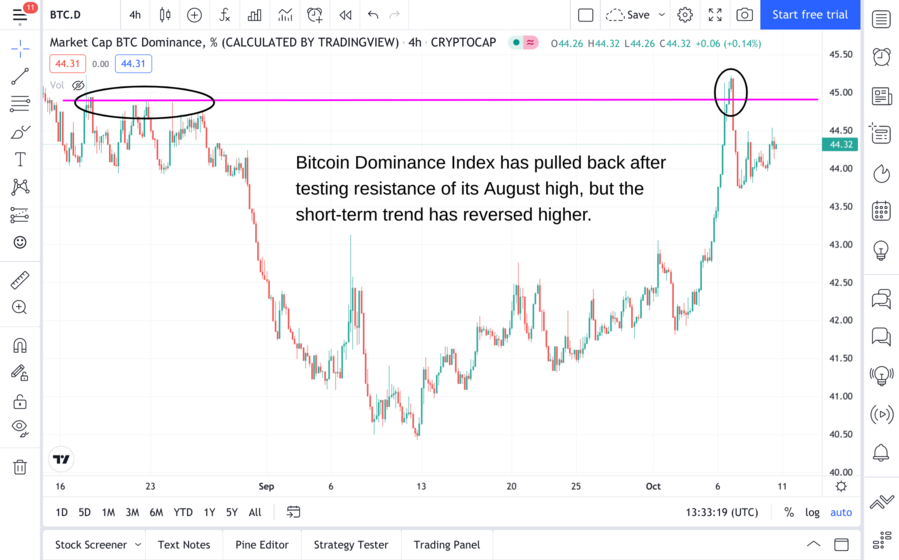
The Bitcoin Dominance Index is likely to maintain its bullish, short-term momentum as long as Bitcoin continues trending higher. When Bitcoin eventually pulls back and takes a rest, then we may expect funds to start rotating back into the altcoin markets. This has been the typical, recurring cycle we have seen many times over the years.
Of course, a sudden flood of new money entering the crypto market could also enable altcoins to rally even while Bitcoin is still on center stage. In the meantime, this is the reason we have not been aggressively looking for new altcoin trades since Bitcoin broke out on Oct. 1.
This recent bullish reversal in the Bitcoin Dominance Index helps you understand why your favorite altcoin may have been lagging while Bitcoin has been cruising steadily higher this month. This is also why we have been discussing the Dominance Index so much over the past week.
Understanding and tracking the current trends of both Bitcoin and the Bitcoin Dominance Index are two simple ways to increase your odds of crypto trading success.
Disclaimer: Past results are not necessarily indicative of future results. There is a high degree of risk for substantial losses in trading securities. All data and material on this website ...
more

