
The performance of financial assets during the first half of 2024 continued strongly with equities, in this column S&P 500, going through the roof and delivering 15,3% – a total return one could reasonably expect over a two-year period. But this strong equity performance was driven by a few large companies.

As you may know, the S&P 500 is capital-weighted, meaning that the companies with largest market cap have the largest weight. The equal-weighted version of the S&P 500 posted gains of only 5,1% – a difference of 10,2%-points! Smaller companies (small caps) had even more meagre returns of below 2% for the year.
Government bonds, on the other side, delivered losses of close to 5%. A widely used benchmark for a balanced portfolio consisting of 60% equities and 40% bonds, earned 7,2% during the first two quarters.
In the alternative’s universe, the year 2024 continued the way 2023 ended, namely with the niche strategies performing quite well while “mainstream alternatives” like private equity and real estate, that most institutional investors have sizable allocations to, had a hard time and delivered lackluster returns at best.
The fund-raising activity was quite resilient in dollar terms, but the number of funds raised tells a clear story that the fundraising currently is a “the winner takes it all” game where mega funds have no issue raising funds while smaller emerging managers are having a hard time to raise just a couple of hundred million.
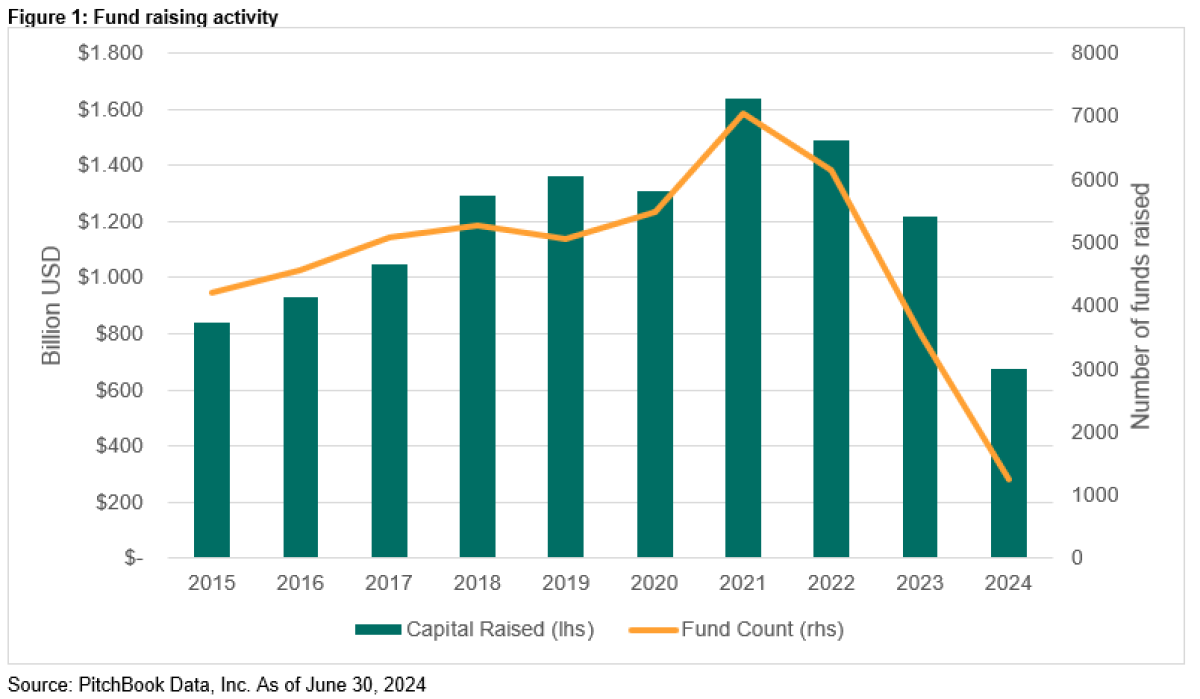
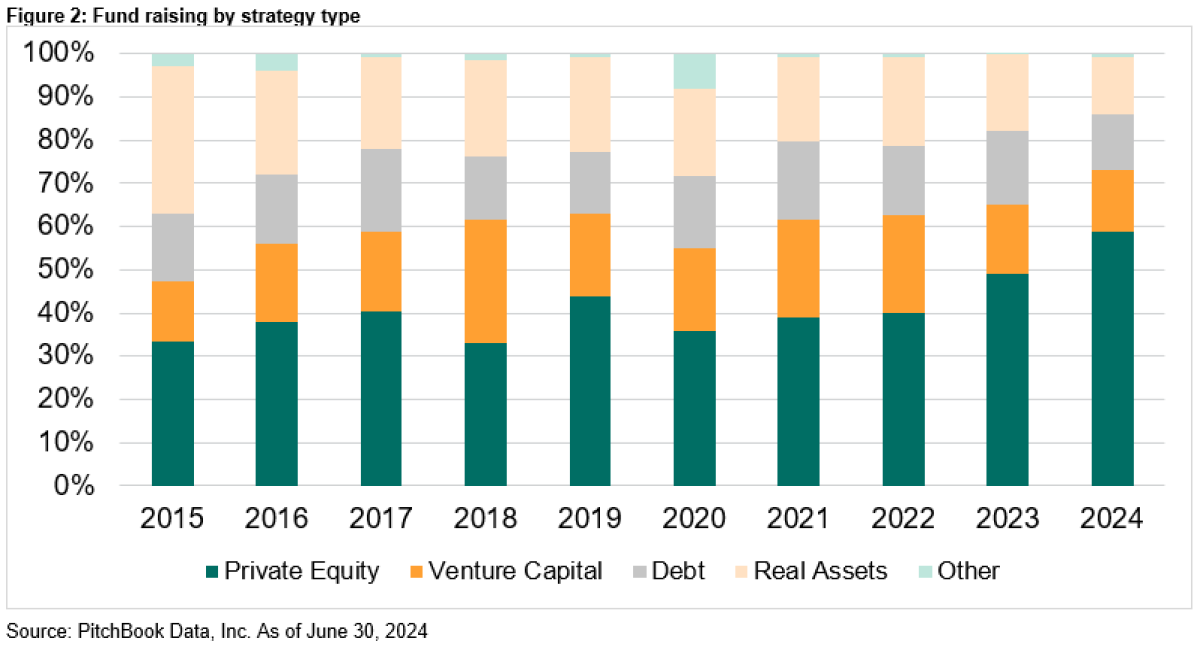
A remarkable fact is that private equity stands for the lion’s share of the total money raised. I would have expected a larger share going to private debt.
The Q2 returns for infrastructure, buyout and venture capital were not available at the time of writing this column as these benchmarks consist of funds that typically have up to 60-90 days after quarter end to send the new NAV.
But before we dig into the numbers, I want to remind you of a few technical facts of importance.
Most alternative investments, aside from liquid alternatives, are long-term investments. To evaluate the performance over a shorter period has limited explanatory power.
There is always a time lag between reported returns and public market returns due to the illiquid nature of the underlying investments.
Alternative investments are very heterogenous in their nature with huge dispersion also on the manager level. The realized returns of an investor will most likely deviate from the benchmark level returns.
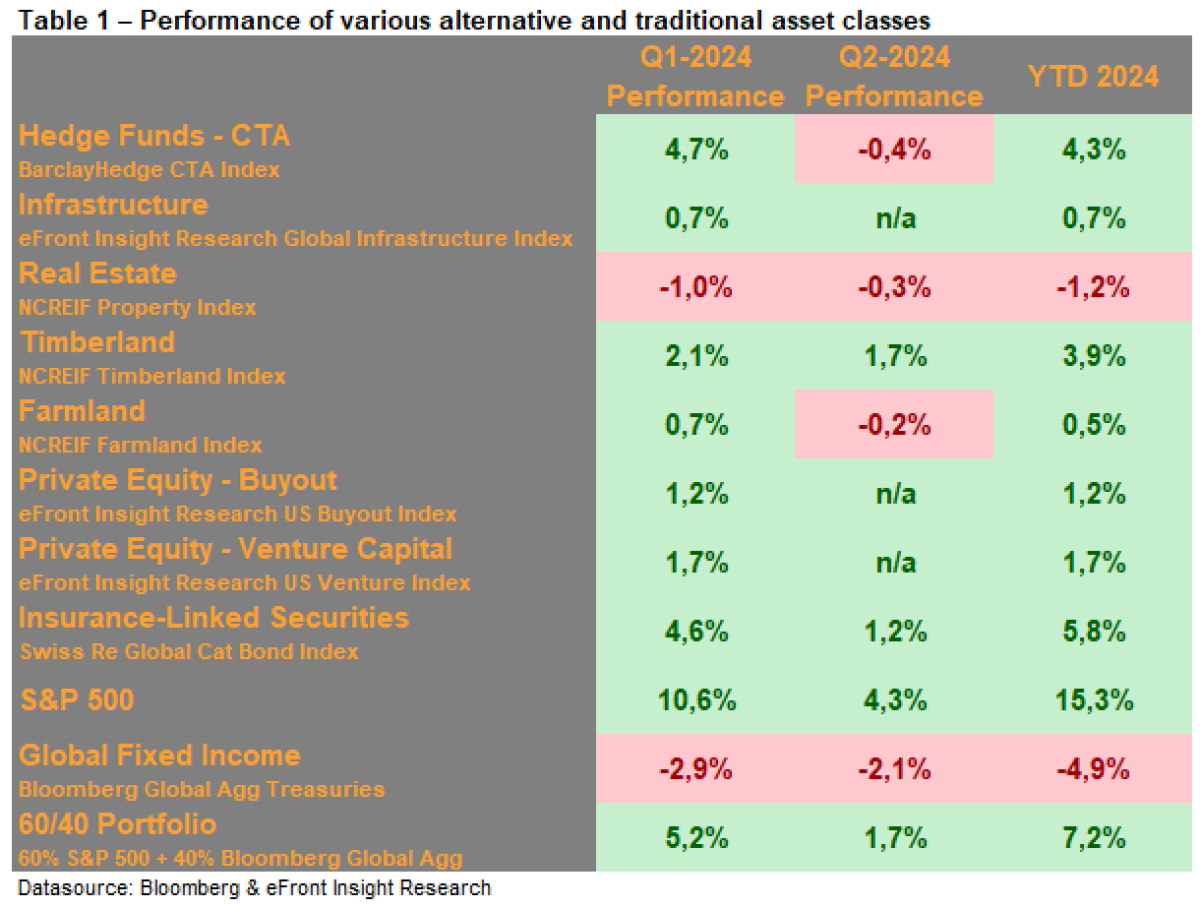
Datasource: Bloomberg & eFront – Insight Research benchmarking
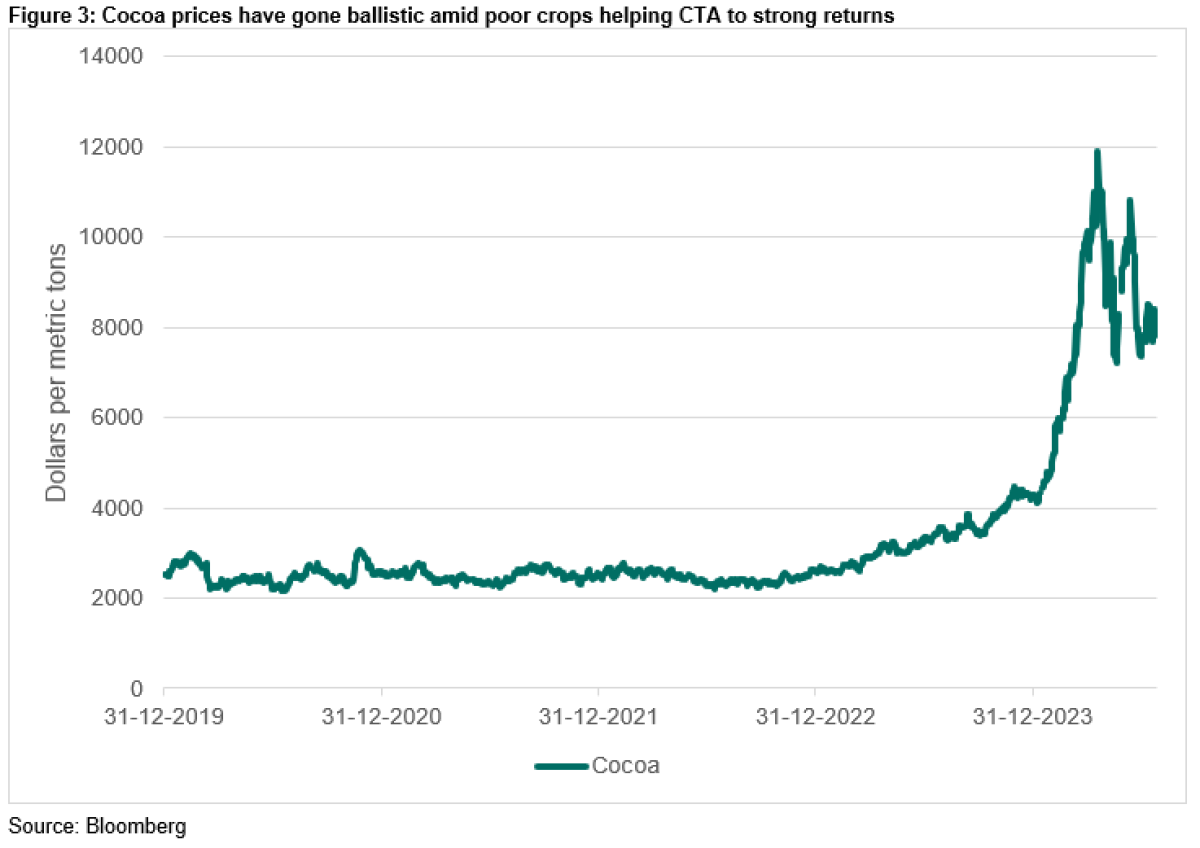
CTA, a sub-asset class from the hedge fund universe that is known for using trend-following models, profited from strong trends both in equity markets but also within commodities and currencies, where long positions in cocoa were a major return driver for some funds especially in Q1 when prices went ballistic after poor crops in top producers Ivory Coast and Ghana. Cocoa lost momentum in Q2 where prices dropped and went sideways but with lots of volatility.
But also short positions in the Japanese yen were major return drivers with the Asian currency falling for the third year in a row (this has reversed at the time of writing this column and will be discussed in more detail in the column covering the second half of 2024).
Return dispersion between managers is also in 2024 enormous. The difference between top and bottom on my watchlist is a staggering 28,6% after the first six months of the year! And there are even funds that are outside this interval.
Slower strategies performed once again better than faster strategies as the faster models got whipsawed from shifting positions.
Infrastructure, as represented by the eFront Insight Research index, an index consisting of unlisted funds, posted a small positive return of 0,7% for the first quarter of 2024. At the time of writing this column, the data for the second quarter was not published yet. Due to the time lag in reporting in private capital funds, the returns reported by pensions funds as of June 30th will consist of the Q4 2023 returns (typically received in May as year-end is audited) and the Q1 2024 return (received in June). The Q4 numbers of the eFront Insight Research Infrastructure index were very positive with 3,6% leading to an accumulated gain of 4,3% over the two quarters. While there was quite some attention to struggling renewable energy developers in 2023, the focus shifted to another sector in 2024 when a lot of attention was placed on the British water utility sector with Thames Water taking the headlines as large investors had to write down/off their stakes in the utility company. The UK water crisis has been heavily debated in the public media and the high debt imposed on the balance sheets to pay dividends to the owners is certainly one major contributing factor to the problems. Other voices are also mentioning that the regulator did not allow prices to rise as much as was needed to make the necessary investments to maintain the infrastructure while politicians blamed “serial mismanagement”. But one thing is for sure: this crisis does not increase the publics’ confidence in the privatization of infrastructure. On a happier note can be mentioned that airport investments are performing very well, with fx Manchester Airport Group (which is partly owned by Australian IFM Investors) reporting record passenger volume. Also investments in data centers are performing well, which once again highlights that it is important to take a nuanced view on the infrastructure asset class as it is fairly diverse.
Real Estate, as represented by the NCREIF Property Index, an unlevered index of directly held properties in the US, continued downwards – albeit at a slower pace and ended the quarter with a loss of 0,3%, bringing the half-year return down to -1,2%. Office, making up app. 23% of the index, was again the main culprit with a loss of
-6,1% year to date. Hotels was the best-performing sub-asset class with a positive return of 2,9% year to date followed by retail with 1,5%. While the latter now has recovered from the Covid-trough, the former is still 2% underwater from the hit by the pandemic, according to NCREIF data. While apartments posted losses in Q1, all sub-asset classes besides office posted gains in Q2. Year-to-date, only offices and apartments are in the red with all other sectors having delivered positive returns. Is now potentially the right time to re-enter the commercial real estate market after several years of challenges? Mercer thinks so.
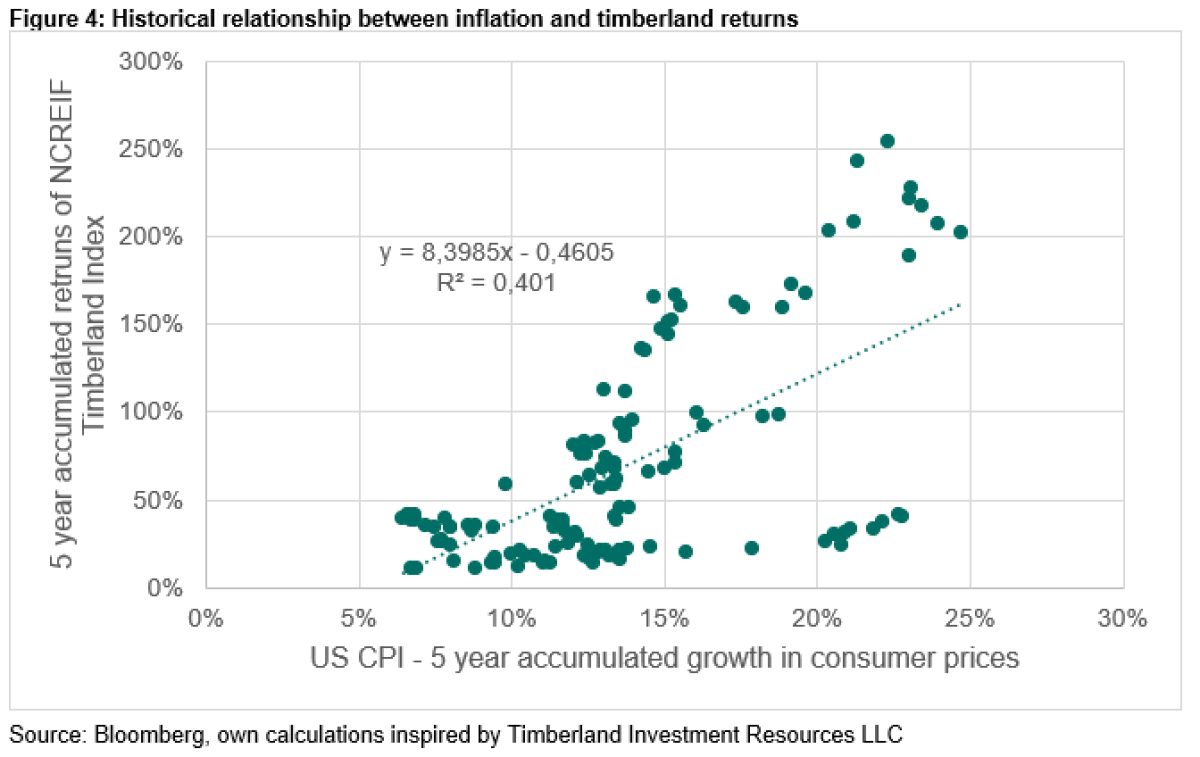
Timberland continued the strong performance and posted positive returns of 1,7% in the second quarter, bringing the year-to-date return to 3,9%. And the best might be yet to come as it is a known seasonality in the timberland index that the strongest performance is in the fourth quarter as most assets are being appraised by third-party appraisers in the fourth quarter. If this pattern repeats itself this year, the already strong year-to-date performance bodes well for the full year return. Timberland has delivered positive returns throughout the last 3 years and confirms its role as being a reasonable inflation hedge, as also shown in figure 4. The interesting thing, though, is that the most recent observations are on bottom right of the chart (high inflation, positive but more moderate returns) and the linear fit hence has been stronger before the last uptick in inflation. One possible explanation for this could be, that there still was an overhang in inventory in the woods since the GFC or that the rise in inflation was so rapid that it did not feed through into timber returns yet.
Farmland, on the other hand, posted a small loss of 0,2% during the second quarter, bringing the year-to-date return down to 0,5%.
Private Equity as represented by the eFront Insight Research US Buyout index and the eFront Insight Research US Venture index, posted a small positive return of respectively 1,2% and 1,7% for the first quarter of 2024. As with infrastructure, at the time of writing this column, the data for the second quarter was not published yet but the reported performance of pension funds consists of Q4 and Q1 numbers. Accumulated performance over those two quarters was 3,8% for Buyout and 2,2% for Venture Capital.
Private Equity markets are still suffering from the lack of exit activity and prolonged hold times of portfolio companies, which leads to some creativity to generate distributions, namely continuation vehicles, where the GPs are selling portfolio companies over either to existing investors or new investors or both in a new SPV. There may be cases where it would be the right decision to roll one’s investment over, but I am in general not in favor of these continuation vehicles as there are too many conflicts of interest.
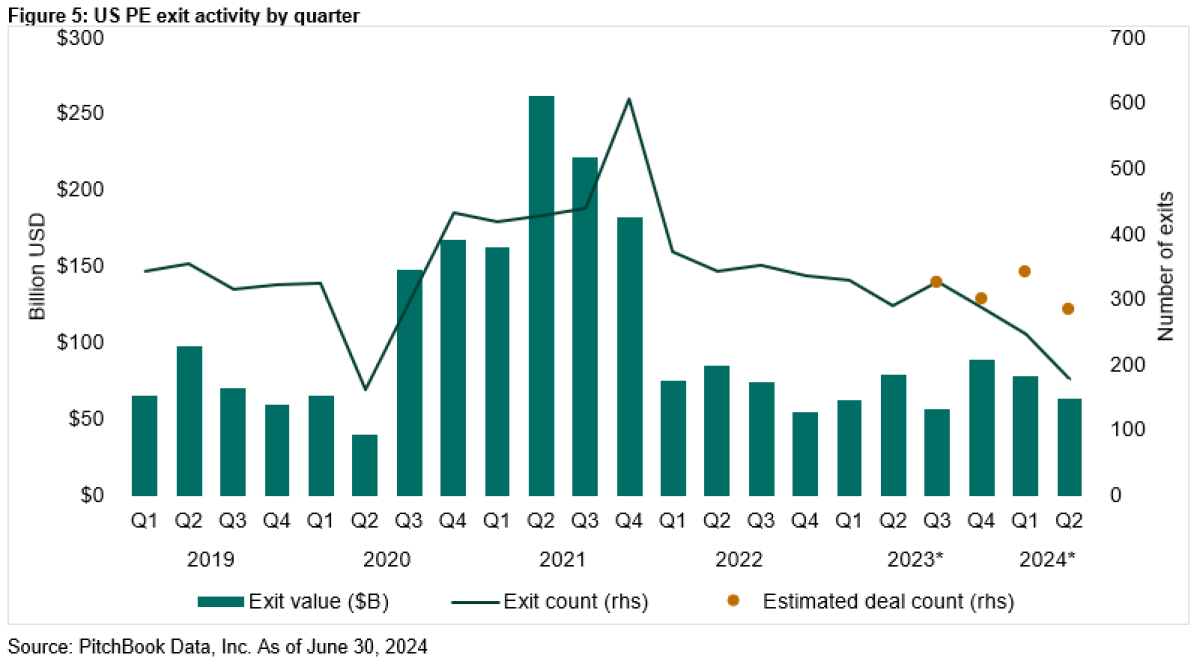
And even though US PE exit value increased by approximately 15.0% YoY in H1 2024, the exit count was largely flat according to PitchBook.
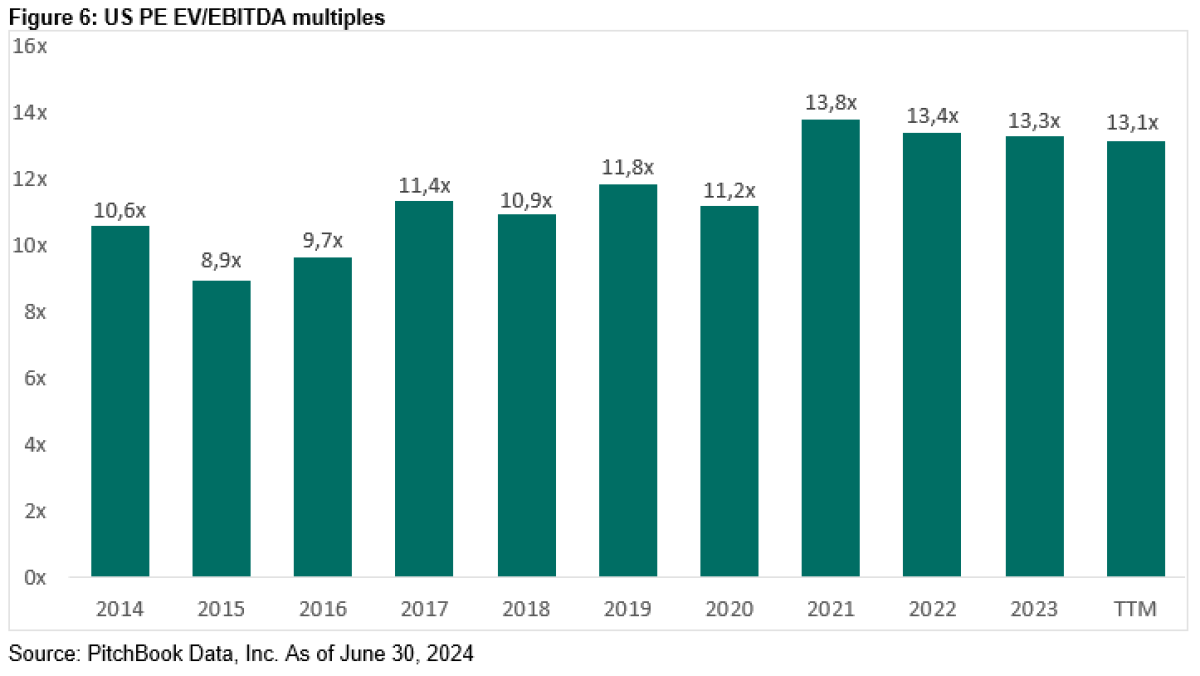
Also the median EV/EBITDA multiple on deals is only slightly down from the record days of 2021, even though interest rates are substantially up and volume down.
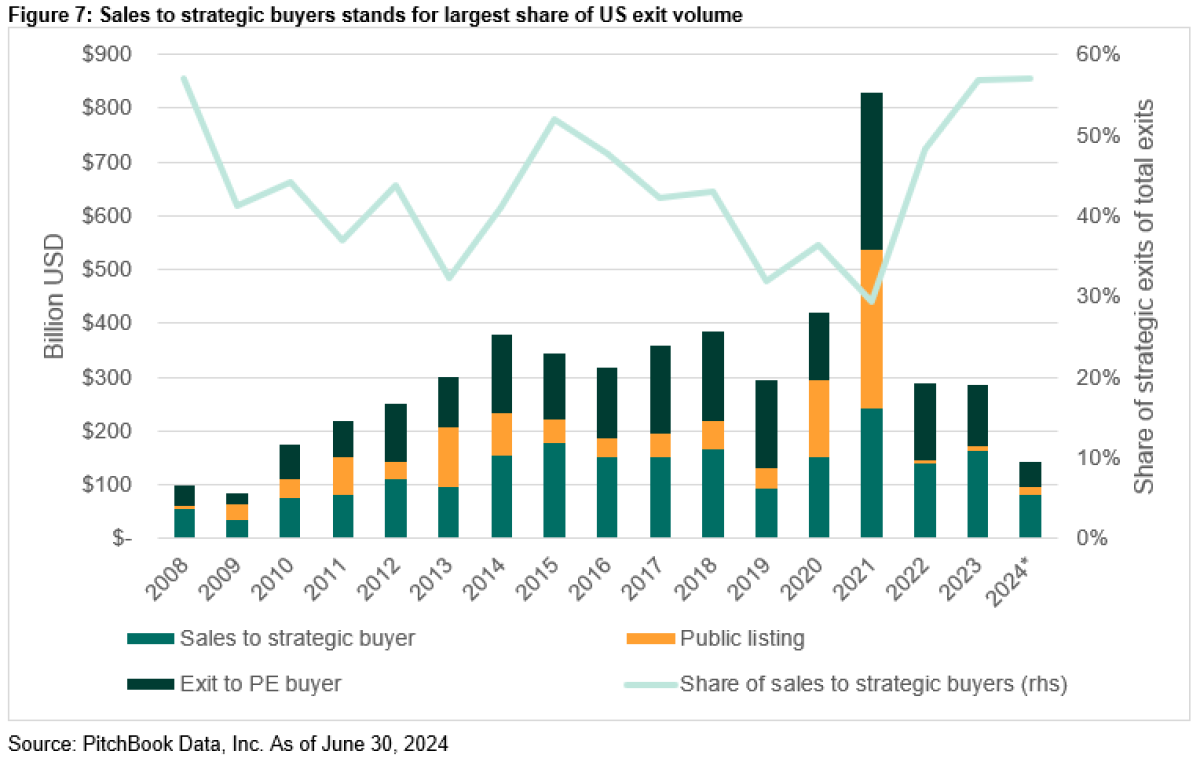
One possible explanation for the relatively robust exit multiples could be the main source of exits: corporates aka strategic buyers, as highlighted in the chart below and this article from Pitchbook.
These are typically large corporates buying smaller competitors or strategic assets for their synergies and are often less price sensitive than sponsors, aka PE funds. But as Figure 7 also shows, the lack of IPO’s is striking.
There seems to be some optimism in the sector regarding the outlook for the second half of 2024. Let’s see whether this increased optimism translates into more exits. LPs starved for distributions would certainly appreciate it.
Insurance-Linked Securities (ILS), often also referred to as “CAT Bonds” (catastrophe bonds), posted a quarterly gain of 1,2% for the Swiss Re Global CAT Bonds Index, bringing the total return year-to-date to 5,8%. The second quarter performance was a bit more muted due to negative performance during May where spreads widened. Important to note, that this was caused by a temporary capital supply/demand imbalance and not by natural catastrophes, according to Schroders Capital. With that being said, the US hurricane season – the major market for ILS – runs from June 1st to November 30th so not unnatural that there weren’t many losses in Q2. Forecasts are anticipating a hurricane season that is more active than average due to high sea surface temperatures. But even though there might be more hurricanes and even stronger hurricanes, this does not necessarily correlate with higher losses as it is the number of landfalls and especially the area where the landfall takes place that is driving the losses, as shown in this analysis by Icosa Investments.
Depending on the hurricane season, ILS could be off for another very positive year as they are also profiting from the higher base rates.
Conclusion:
The first half of 2024 continues the trend of 2023 where “mainstream alts” like private equity, infrastructure and real estate are delivering disappointing returns while niche asset classes like CTA, ILS and timberland are performing well. As most institutional investors have their largest allocation to real estate and private equity and less (or none) to the niche asset classes, the performance contribution to the overall returns was most likely limited. But still important to highlight the dispersion on manager level, that can lead to substantially different outcomes than the benchmark returns.
CTA started the year very strong but gave up some of their returns in Q2 (and even more in Q3 – but this is for the next column) when trends started to reverse.
Private equity returns are still lagging listed equities but as mentioned earlier, the performance of public equities has been largely driven by few large-cap stocks while small caps have had performance in line with private equity. It is also worth noting that the currently lackluster performance comes after a healthy outperformance in 2022, meaning that public equities are catching up. We are monitoring closely whether the exit environment improves from here. There are a few signs but too early to tell.
I am still a cautious optimist for the rest of 2024, but the development is fraught with great uncertainty and the year may turn out to be a volatile year. We already got a foretaste of that in early August when the Yen carry trade got an abrupt ending. The higher base rates are, certeris paribus, good for strategies with large cash collateral like CTA and ILS, but also private debt stands to profit from higher rates while investors in private equity and real estate hope for lower rates. This once again highlights the importance to also diversify your diversifiers.
More By This Author:
Investment Migration: An Opportunity For Alternative InvestorsStress Scenarios For Private Capital Fund Portfolios
Why Private Debt?


Comments
Log in or sign up to join the conversation.