
ETH/USD: Will The Breakdown Sequence Accelerate?
Ethereum is suffering from an increasingly bearish fundamental scenario, supported by technical conditions. Developers continue to exit the project, attracted by better long-term opportunities provided at TRON, Tezos, Binance, and others. Ethereum miners have been unprofitable, and smaller operations are switching to other coins. This weakens the network, limits its security, and reduces transaction speeds. The future for Ethereum is uncertain, and the ETH/USD is on track to extend its breakdown sequence. A move below $100 is likely to erode confidence further.
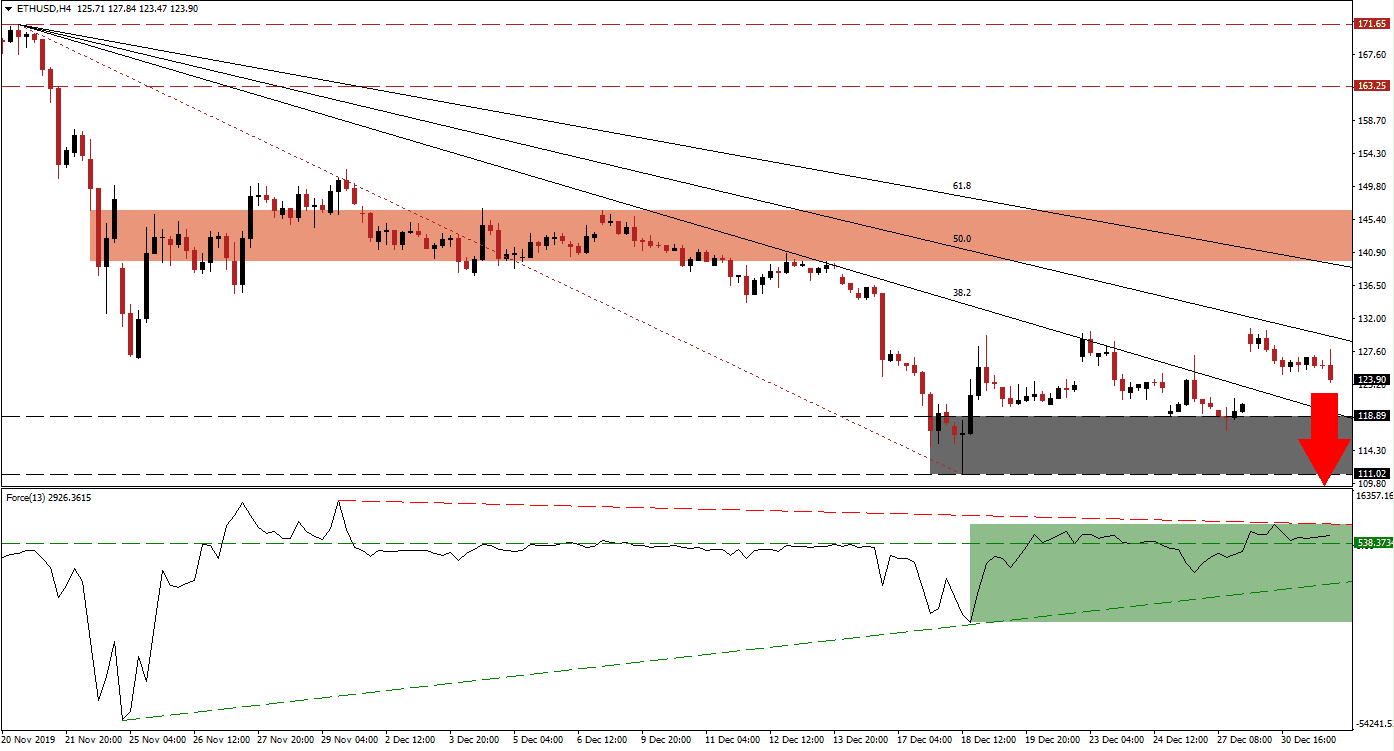
The Force Index, a next-generation technical indicator, was able to recover after a higher low resulted in the formation of an ascending support level. The Force Index converted its horizontal resistance level back into support and moved into positive conditions. While bulls took control of price action, long-term bearish fundamental developments apply a greater amount of bearish pressures on the ETH/USD. The descending resistance level is favored to force this technical indicator into a retreat, leading to a fresh breakdown.
Adding to the bearish technical scenario is the crossover of the entire Fibonacci Retracement Fan sequence below the short-term resistance zone. This zone is located between 139.71 and 146.68, as marked by the red rectangle, and was previously able to halt the sell-off in the ETH/USD. Delays of critical upgrades to the network have added to frustrations and assisted the departure of developers and miners, a trend anticipated to accelerate in 2020. A series of hard forks intended to resolve structural issues failed to deliver as expected, and the ongoing delay of the difficulty time bomb embedded into the code in 2015 is causing extra friction in the development community.
This cryptocurrency pair attempted to break free of its bearish trading environment with a price gap to the upside, off of the top range of its support zone. It was rejected by its descending 50.0 Fibonacci Retracement Fan Resistance Level. The Fibonacci Retracement Fan sequence is anticipated to pressure the ETH/USD into a breakdown below its support zone located between 111.02 and 118.89, as marked by the grey rectangle. Price action is favored to descend below the key psychological level of $100, with the next support zone between 76.59 and 86.55.
ETH/USD Technical Trading Set-Up - Breakdown Extension Scenario
- Short Entry @ 125.00
- Take Profit @ 80.00
- Stop Loss @ 135.00
- Downside Potential: 4,500 pips
- Upside Risk: 1,000 pips
- Risk/Reward Ratio: 4.50
A breakout in the Force Index above its descending resistance level may allow the ETH/USD to push higher. Due to the deteriorating fundamental outlook, the upside potential for this cryptocurrency pair remains limited. While a temporary push above its short-term resistance zone cannot be ruled out, the intra-day high of 152.14 may end any advance. The next long-term resistance zone awaits price action between 163.25 and 171.65, but out-of-reach in the current environment. A breakout should be considered an excellent short-selling opportunity.
ETH/USD Technical Trading Set-Up - Limited Breakout Scenario
- Long Entry @ 142.00
- Take Profit @ 152.00
- Stop Loss @ 137.00
- Upside Potential: 1,000 pips
- Downside Risk: 500 pips
- Risk/Reward Ratio: 2.00
(Click on image to enlarge)
Disclosure: DailyForex will not be held liable for any loss or damage resulting from reliance on the information contained within this website including market news, analysis, trading signals ...
more

