
Ethereum Price Analysis: ETH Growth Perspectives Are Mired As Miners Dump Their Coins
At the time of writing, Ethereum (ETH) is trading at $400. The second-largest digital asset with the current market capitalization of $44.2 billion and an average daily trading volume of $15 billion has lost nearly 3% in the last 24 hours. However, it is still in a green zone on a week-to-week basis.
A failure to move above the critical resistance of $420 triggered the downside correction and pushed the price to the channel support.
ETH miners start dumping their coins
According to the on-chain data provider Santiment, ETH miners have started dumping their coins after the ETH price reached the recent high. This emerging trend may be the first signal that the FOMO has started to fade out on the market. Historically, the asset price goes down when miners are beginning to move their coins to the exchanges as the selling pressure increases.
However, it should be noted that from the longer-term perspective, the miners' balance is still above the recent low reached at the beginning of September. Thus, the general trend remains positive, while the price may be vulnerable to the downside correction in the short-term.
ETH miners balance
(Click on image to enlarge)
%20[13.48.30,%2027%20Oct,%202020]-637394008588389008.png)
Source: Santiment
Volatility ahead
Apart from that, Age Consumed printed several spikes in recent days. This indicator predicts the upcoming price volatility as it shows the number of coins changing addresses on a specific date, multiplied by the time since they last moved.
While the spikes are less pronounced than before, they may add credibility to the signals provided by the miners' balance indicator.
Ethereum Age Consumed indicator
(Click on image to enlarge)
%20[13.55.11,%2027%20Oct,%202020]-637394008822942076.png)
Source: Santiment
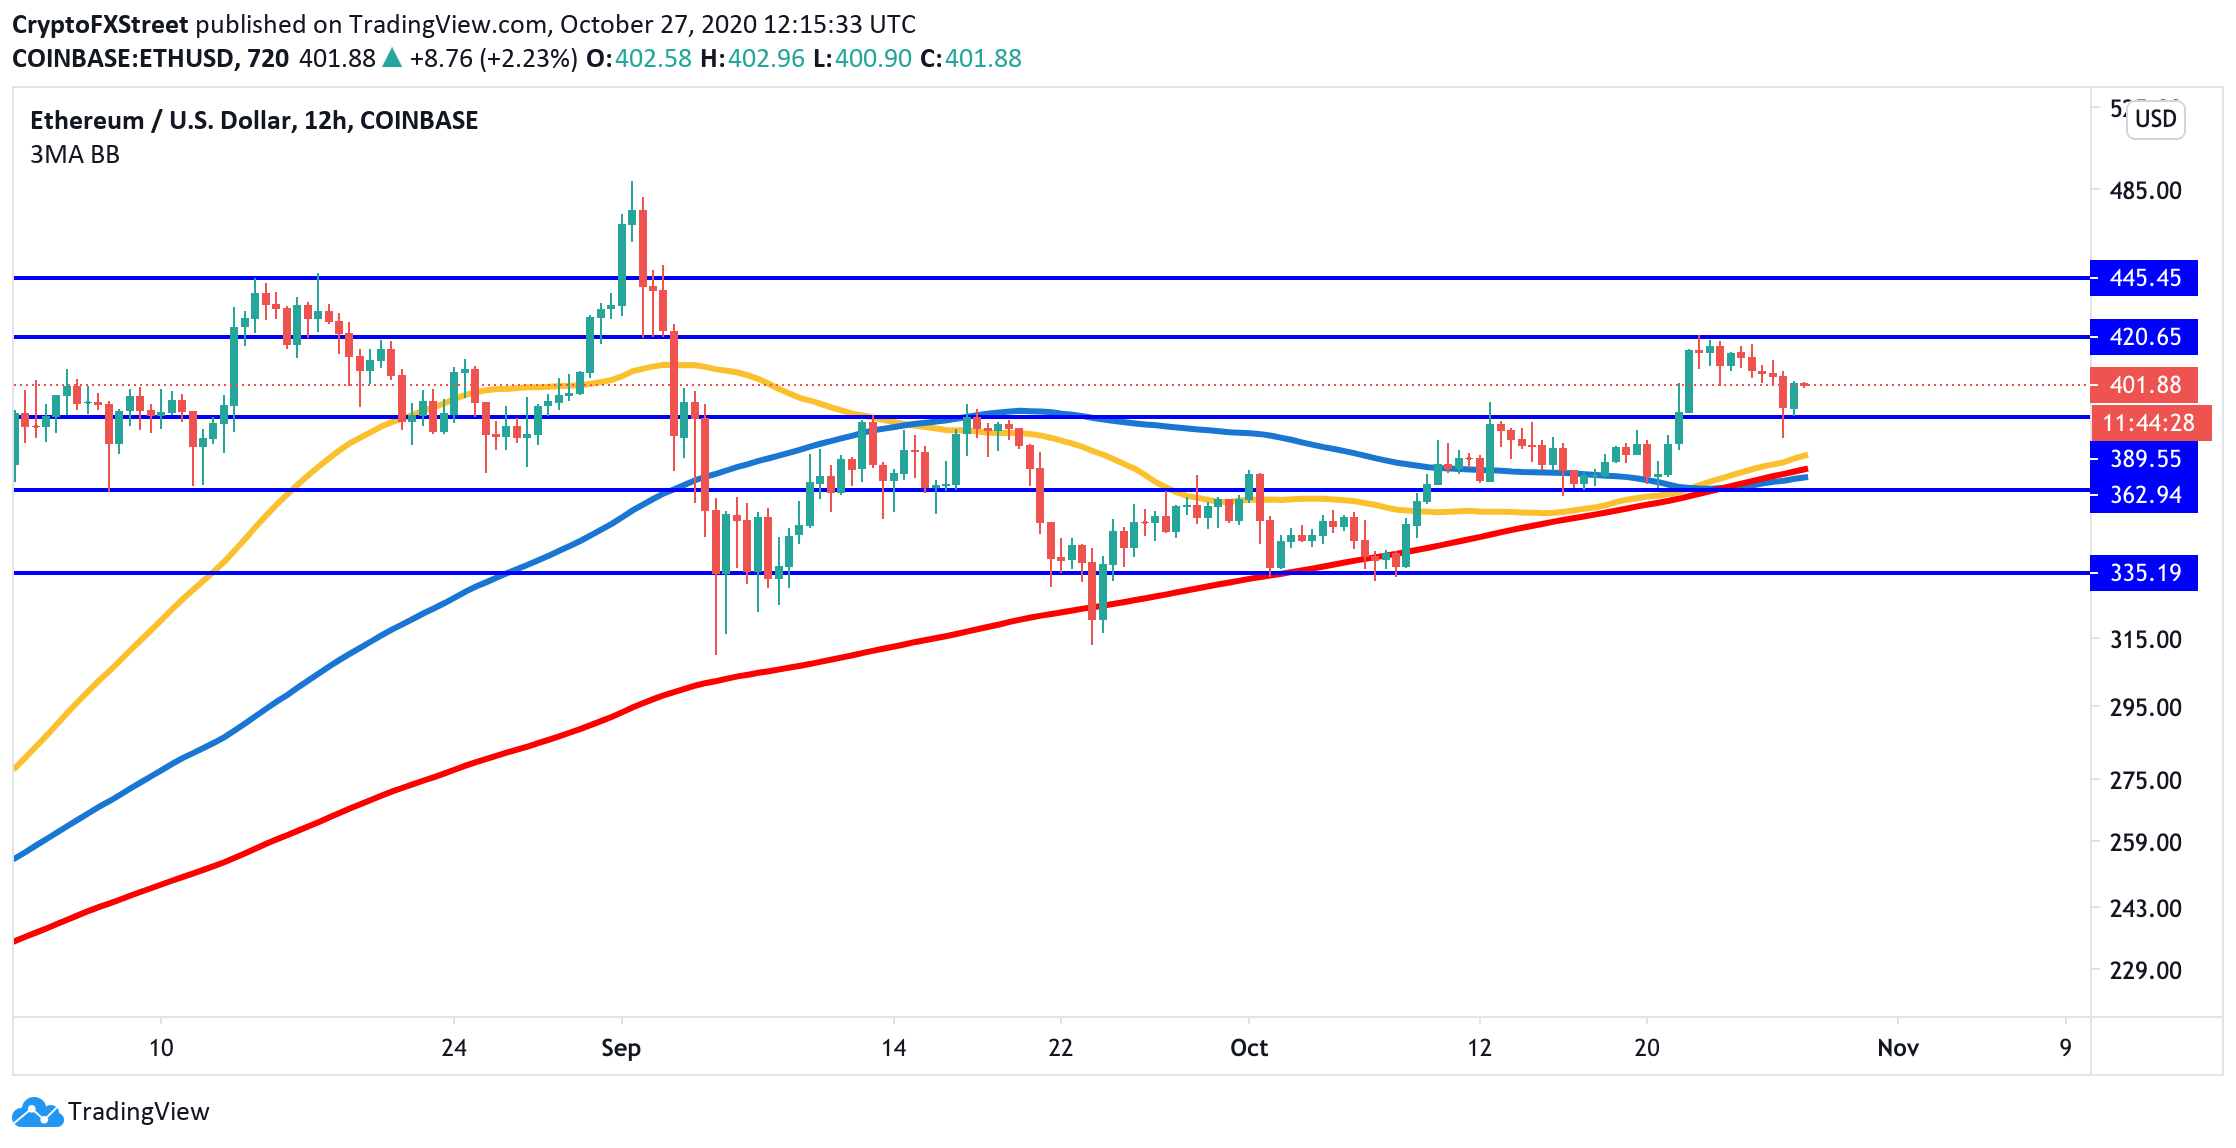
ETH/USD rebounds from the channel support
From the technical point of view, a failure to clear a strong barrier created by $420 may signal that the upside momentum is fading away. The second-largest cryptocurrency rebounded from the channel support of $390. If it is broken, the sell-off may gain traction with the next focus on $360. A cluster of EMAs on the 12-hour chart, located on the approach to this support level, will make it a challenging target for the bears.
ETH/USD 12-hour chart
(Click on image to enlarge)
Meanwhile, the data on market positioning implies that there is a strong barrier located on the approach to $390, meaning that this support can effectively stop the correction and send the price back to $420.
IntoTheBlock's data on In/Out of the Money Around Price (IOMAP) signals that there is strong support between the current price and $390 as there are nearly 1 million addresses holding over 11 million coins there. Once it is cleared, the sell-off will gain traction as there are no significant support levels below this area.
Ethereum: IOMP data
(Click on image to enlarge)
%20Analytics%20and%20Charts%202710-637394009304706262.png)
Source: IntoTheBlock
On the bullish side, a sustainable move above $420 in this area is needed for the upside to gain traction. Once this barrier is out of the way, ETH can quickly retest $450 and $460, which is the yearly high. Considering that there are no major supply walls above the current price, this area should be an easy target for ETH bulls if the price remains above $390.
Disclosure: Information on this article contains forward-looking statements that involve risks and uncertainties. Markets and instruments profiled on this page are for informational ...
more

