
ETH/BTC Is Turning Back To Bearish Mode
Today we will talk about the ETH/BTC cryptocurrency pair, its price action from a technical point of view, and wave structure from the Elliott Wave perspective.
ETH/BTC, Weekly
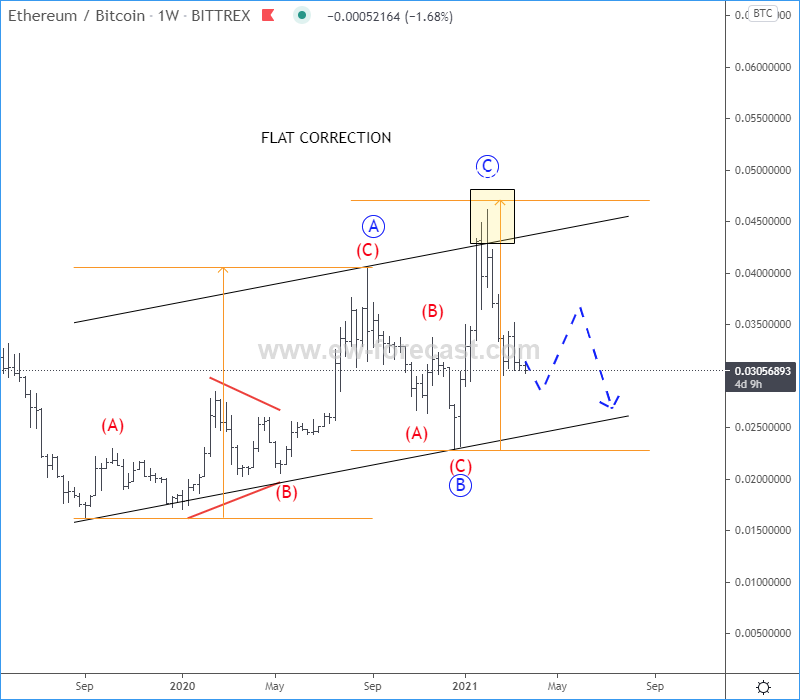
Looking at the weekly ETH/BTC chart, we can see quite slow and choppy price action with overlapped wave structure which indicates a correction called an A-B-C flat correction with a perfect target at the channel resistance line and equality measurement of waves A=C.
ETH/BTC, 4h
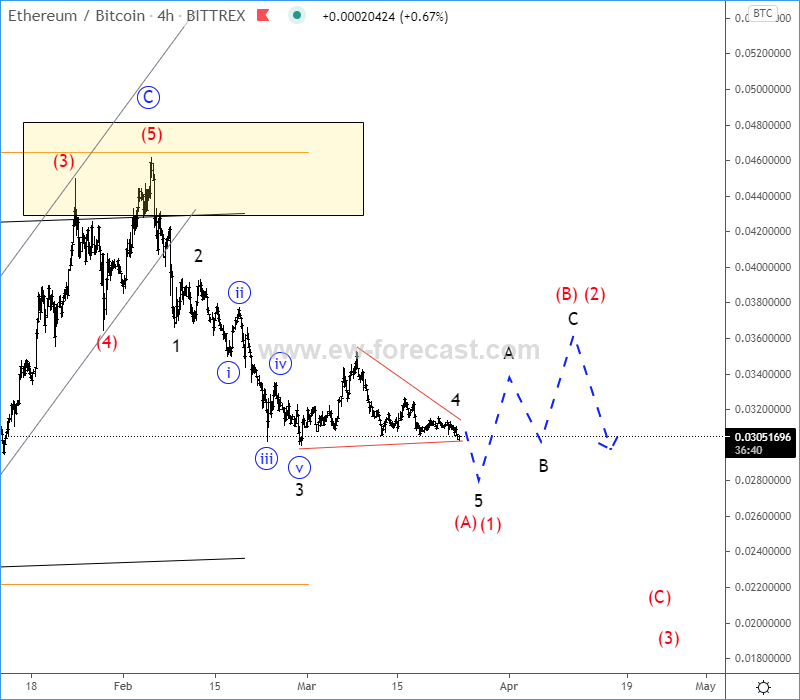
Well, with the current strong decline, which can be seen as a potential five-wave drop on the 4-hour chart, seems like ETH/BTC is turning back to bearish mode, so be aware of more weakness in upcoming weeks/months within wave (C)/(3), but be aware of a corrective pullback in wave (B)/(2) that can occur once a bearish five-wave cycle in wave (A)/(1) fully unfolds.
Disclosure: Please be informed that information we provide is NOT a trading recommendation or investment advice. All of our work is for educational purposes only.


