
Winning The Low-Volatility War
A rose may be a rose, but there are definitive differences among low-volatility ETFs. Historically, they may suffer price deviations to a lesser degree than the market, but the derived benefit can vary substantially. Some funds are exemplars of the low-volatility anomaly where the Capital Asset Pricing Model (CAPM) is stood on its head, rewarding investors for taking on less risk. Others, not so much.
Now, more than ever, these portfolios are being tested. But here’s the thing: Current research indicates that reliance on historical beta or standard deviations may not adequately inform investors and advisors of the true potential of low-vol ETFs in tumultuous times such as these. So what can we do to better gauge expected returns going forward?
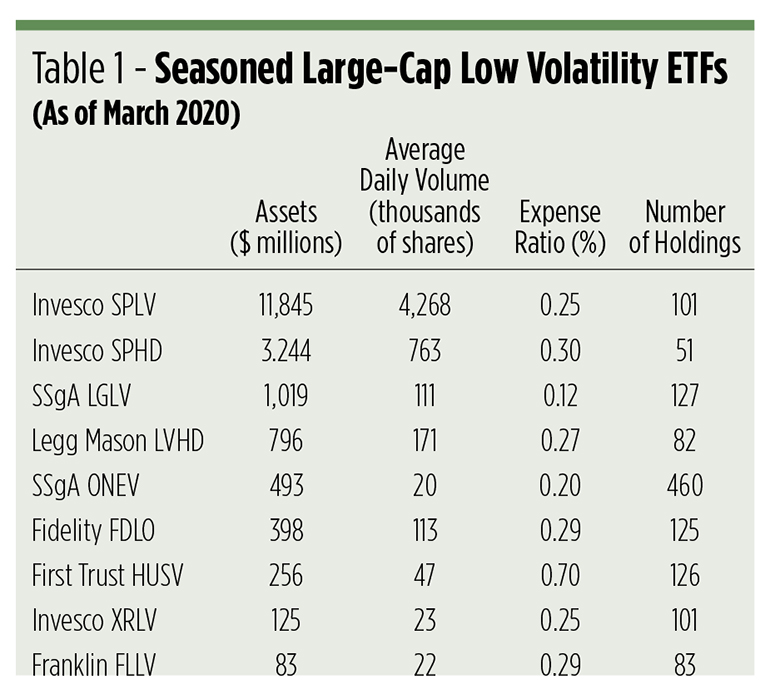
The first thing to do is identify the players on the field. As Table 1 illustrates, there are nine seasoned low-vol ETFs focused on the domestic large-cap market. With a 65% market share, the eldest and largest is the nine-year-old Invesco S&P 500 Low Volatility ETF (NYSE Arca: SPLV). Investors have tucked $11.8 billion into SPLV and they seem well-served for doing so. It’s the exemplar of simplicity. About a hundred of the S&P 500’s least volatile stocks—measured by daily standard deviations over the preceding 12 months—make up the SPLV portfolio. No other constraints are imposed.
Another subset of the S&P 500 is tracked by the Invesco S&P 500 High Dividend Low Volatility ETF (NYSE Arca: SPHD). Here, 50 of the least-volatile issues are plucked from the benchmark’s top dividend payers. As a consequence, SPHD skews toward utilities and other defensive sectors, eschewing high-momentum industries like technology and cyclicals.
The SPDR SSgA Large Cap Low Volatility ETF (NYSE: LGLV) scours a broader universe to look for low-vol stocks. By applying a volatility optimizer to the Russell 1000 Index, the fund’s algorithm screens for turnover, momentum and beta to arrive at a portfolio of 127 issues with three-quarters the volatility of the S&P 500.
Another take on high dividends is offered by the Legg Mason Low Volatility High Dividend ETF (Nasdaq: LVHD), a fund that screens for dividend sustainability as well as price volatility. The fund’s index methodology also imposes constraints on concentration, liquidity and turnover in an effort to generate a so-called stable yield.
The SPDR Russell 1000 Low Volatility Focus ETF (NYSE Arca: ONEV) harvests its components from the Russell 1000 after scoring them for factor, i.e., quality, value, size and volatility, exposures. Emphasis is given to stocks tilting to the low side of the volatility spectrum.
Like ONEV, the Fidelity Low Volatility Factor ETF (NYSE Arca: FDLO) runs a scoring rubric on a 1,000-stock universe, looking for issues with low price and earnings volatility, together with modest beta exposure.
The actively managed First Trust Horizon Managed Volatility Domestic ETF (NYSE Arca: HUSV) relies on the modeling of future volatility to select portfolio issues with the lowest expected standard deviations. The portfolio’s breadth and weighting is entirely discretionary.
A rather unique approach is taken by the Invesco S&P 500 ex-Rate Sensitive Low Volatility ETF (NYSE Arca: XRLV), a fund that links volatility to interest rate sensitivity. The fund’s methodology culls the parent index of stocks that fared worst in rising rate environments over the preceding five years, leaving 100 issues that are then weighted by the inverse of their volatilities to form the portfolio.
Another active fund, the Franklin Liberty U.S. Low Volatility ETF (NYSE Arca: FLLV), is built up from the bottom based on fundamental analysis. Sector allocations comport with those of the Russell 1000, though issues within each sector are equally weighted.
Past as prologue?
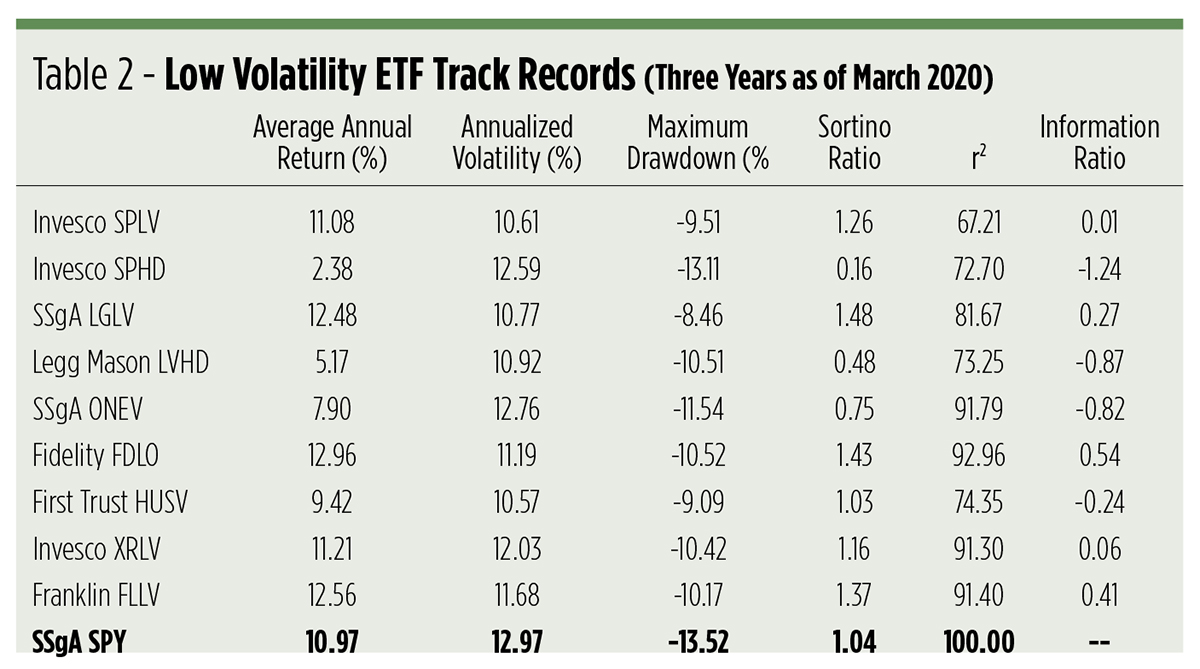
A look back at market action over the past three years (see Table 2) hints of the funds’ ability to tame volatility. Historically, five of the low-vol ETFs produced higher average annual returns than the SPDR S&P 500 ETF (NYSE Arca: SPY), proof that less is often more. Less volatility, more returns, that is. While all the ETFs shaved some volatility off the S&P 500, some were better focused on specifically trimming downside deviation. Take note that the Sortino ratios for the five outperforming funds are markedly higher than that of SPY.
But what of the future? Will these funds offer enough volatility insulation to justify their cost? Will investors even need such protection going forward?
According to Tom McClellan, editor of The McClellan Market Report, higher volatility is an enduring trend that is likely to last another year. He bases his contention on the historical correlation of T-bill yields, shifted two years forward, to the Cboe Volatility Index (VIX).
“The rise in T-bill yields which was taking place leading up to the March 2019 top is now getting echoed in an uptrending set of values for the VIX Index,” says McClellan. “That process is not yet complete, and it won’t be complete until March 2021.” He warns that volatility spikes leading up to next year’s top could be higher than what we’re seeing currently.
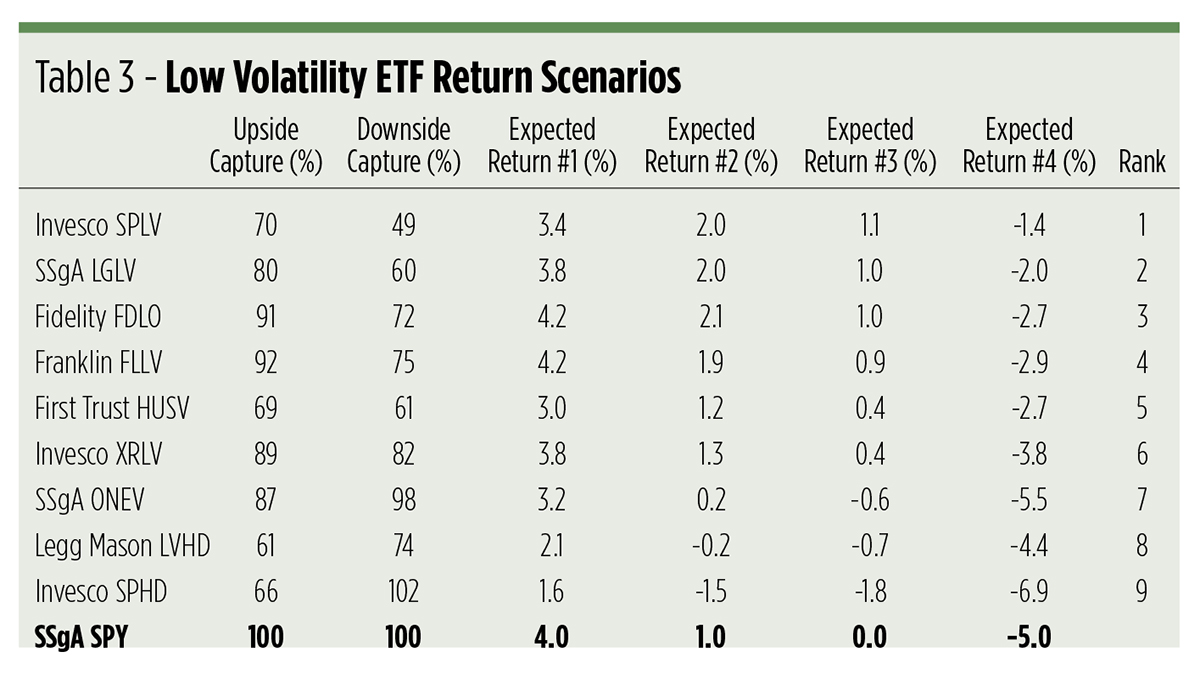
So let’s posit a few future scenarios and see where the volatility chips might fall (see Table 3). We’ll rely on each fund’s upside and downside capture rates versus the S&P 500 to help us derive expected returns over the next 12 months. Imagine the four setups below:
- Scenario #1—70% chance of a 10% gain; 30% chance of a 10% loss
- Scenario #2—70% chance of a 10% gain; 30% chance of a 20% loss
- Scenario #3—50% chance of a 10% gain; 50% chance of a 10% loss
- Scenario #4—50% chance of a 10% gain; 50% chance of a 20% loss
Scenario #1 yields an expected 12-month return for SPY of 4%. In this case, two of the low-vol portfolios—Fidelity’s FDLO and Franklin’s FLLV—are likely to outperform the market. All the rest lag, to one degree or another.
When the market’s expected return is 1%, as it would be under Scenario #2, six of the low-vol ETFs outperform SPY, led by the Invesco SPLV and State Street LGLV funds. Notably, the two high-dividend portfolios turn in negative numbers.
The same six funds that outdid SPY in Scenario #2 surpass the benchmark when the market’s expected to be flat as in Scenario #3. Negative returns could be expected from three of the low-vol ETFs.
Scenario #4 is the bleakest landscape. All of the ETFs can be reasonably expected to produce negative returns with the market down 5%. Still, seven funds do better, i.e., lose less, than the benchmark.
And the winner is …
By virtue of its low downside capture stat, the Invesco SPLV fund produces the highest average expected return, earning it the topmost rank in our study. Fortunately, most of the money invested in large-cap low-vol ETFs is held by SPLV, so this portfolio’s worth is not being ignored by investors and their advisors.
Close behind is the State Street LGLV portfolio, which commands less than 6% of the table’s assets. Even less money—about 2%—is stashed in the third-place Fidelity FDLO fund, despite its high upside capture rate.
Paradoxically, the Invesco SPHD portfolio owns an 18% market share—second-best in assets held—but scrapes the bottom of the table at ninth place. SPHD’s high downside capture rate greatly reduces its performance relative to its peers and to the market.
If there’s a lesson to be learned from our little thought experiment, it’s that the combination of a high dividend and a low volatility tilt may produce suboptimal future returns.
Keep that in mind if you are tempted to run for cover from the market’s ongoing whipsaws.
Disclosure: None.


