
Why I Won't Be Buying Any FANGs Right Now
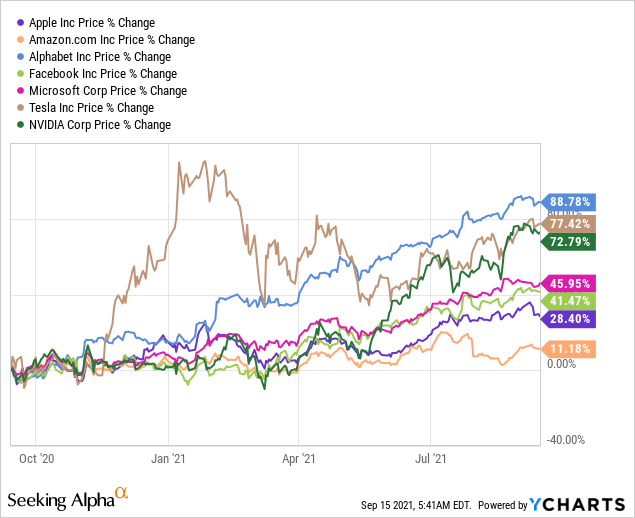
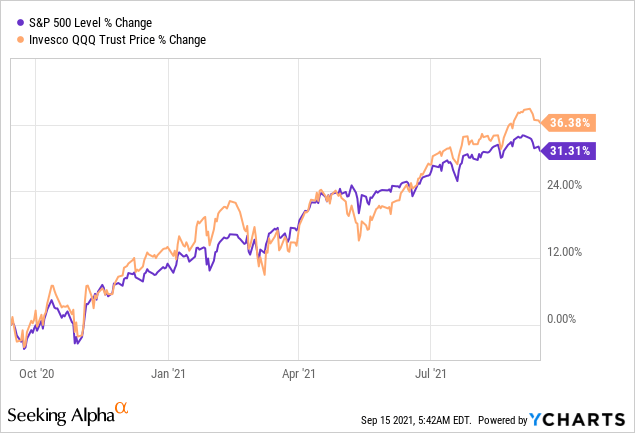
FANGs have been fantastic investments for years, and they have become enormously popular. By the way, when I mention FANGs, I am talking about the most prominent U.S. technology companies. Tech giants like Apple (AAPL), Amazon (AMZN), Facebook (FB), Alphabet (GOOG), (GOOGL), Tesla (TSLA), Microsoft (MSFT), Nvidia (NVDA), and others are now THE global market-leading companies. In fact, the seven most significant S&P 500 components by weight are giant tech firms that remarkably account for more than 25% of the index's total weight. The Nasdaq 100/Invesco's QQQ ETF is even more top-heavy, with its top 10 holdings accounting for more than 53% of the ETF's total weight.
Data by YCharts
Data by YCharts
We see that most "FANGs" are up by a lot, most much more so than the "market." In fact, Tesla, Nvidia, and Alphabet are up by more than twice as much as the SPX over the last year. Also, if we look at the Nasdaq 100 ETF, we see that QQQ outperforms SPX to the upside, but it overshoots the major average to the downside as well. Furthermore, we see that when QQQ went notably higher than the SPX early in the year, technology stocks ended up going through a considerable correction. I believe we could be approaching another adjustment period, where high-flying FANGs could go through a substantial pullback/correction phase.
P/E Ratios Have Expanded Substantially Lately
Valuations in many FANGs have exploded higher lately, and such a spike in P/E ratios could be the prelude to another adjustment period in markets. When Apple was trading at a P/E ratio of 10-15 several years ago, I pounded the table on how cheap the stock was. Now that Apple's P/E ratio is around 30, the stock is far from cheap anymore. Microsoft is closing in on a P/E ratio of 40, which is quite expensive for a company that typically traded at a P/E ratio of about 10-20 in prior years. We usually saw a P/E ratio of 15-20, sometimes 30 in Nvidia in recent years, but now the company's P/E ratio is around 70. Tesla is a separate story as the company recently earned a P/E ratio for the first time, but it's at an astronomically high 300 plus if we're looking at trailing figures. Alphabet and Facebook have shown relatively stable P/E ratios in recent years, but both have a P/E ratio of around 30, and both companies rely heavily on ad revenues. Amazon is the only tech giant to show a notable drop in its P/E ratio in recent years, but this is likely because its growth rate is declining substantially. And, of course, Amazon is far from cheap, sporting a trailing P/E ratio of about 85 right now.
Suppose we average out the P/E ratio of the top 7 tech giants, in that case, we arrive at a forward price to earnings ratio of around 53, roughly 140% higher than the 22 projected forward P/E ratio on the SPX and about 90% higher than the expected 29 P/E ratio on the Nasdaq. This dynamic illustrates that demand for ultra big-cap tech is enormous, and market participants are bidding up prices and driving up valuations to extraordinary levels. Naturally, sentiment could change swiftly, as it often does, which could end badly for some investors.
Is The Potential Growth Really Worth It?
With such frothy valuations, you would think that the big tech FANGs will show a lot of EPS growth next year, but that is not necessarily true. For instance, Alphabet is expected to grow EPS by just 6% next year. Apple is even worse, as analysts anticipate anemic EPS growth of only about 1.25%. Facebook should expand EPS by about 13%, according to analysts, and Microsoft by 14%. According to consensus analysts' projections, Nvidia's EPS is set to rise by 11%, Amazon's by 26%, and Tesla's by 33%.
While EPS growth is robust in some names, the question is whether it justifies such lofty valuations. Let's look at PEG ratios for the FANG seven, like price to earnings growth ratios should give us a sense of how cheap or expensive these stocks are. I want to remind readers that, typically, a PEG ratio of above one implies that a stock may be overvalued while a PEG ratio of below one usually signals that a stock is cheap right now.
| Stock | AAPL | MSFT | GOOG | FB | NVDA | AMZN | TSLA |
| Forward P/E | 26.4 | 34.5 | 28.3 | 26 | 53 | 65 | 136 |
| EPS Growth | 1.25 | 14 | 6 | 13 | 11 | 26 | 33 |
| PEG | 21.12 | 2.46 | 4.72 | 2 | 4.82 | 2.5 | 4.12 |
Source: Author's Material
We discussed that FANG names are far from cheap on an EPS/Price to Earnings basis, but they also look costly from a PEG perspective. For instance, Apple seems significantly overvalued with its low EPS growth rate and subsequent high PEG ratio. Google is far from cheap due to its relatively low EPS growth projection for next year as well. Also, Tesla's and Nvidia's PEGs are pretty high. Microsoft, Amazon, and Facebook are the cheapest but are still more than twice as expensive as "fairly valued" stocks should be going by traditional PEG valuation.
The Bottom Line
Now, I still own some FANGs, Google, Facebook, and Tesla, to be exact. However, my All-Weather portfolio is mostly deFANGed for now, as I put hedges in place for my remaining big-tech positions. Additionally, I recently sold Amazon, and I sold Netflix last quarter. Furthermore, I have not owned Apple or Microsoft for several months now. In addition, I reduced the entire tech segment of my portfolio by about 40% recently. My remaining positions are well hedged via covered call and spread options strategy. Nevertheless, I will increase exposure to FANG names once again when prices and valuations come down and more certainty returns to markets.
Disclosure: I/we have a beneficial long position in the shares of TSLA GOOG FB either through stock ownership, options, or other derivatives. I wrote this article myself, and it expresses ...
more

