
Where Next For The XLE?

Image Source: Unsplash
While the energy sector continues to outperform on a year-to-date basis, the past week has seen the sector fall back along with almost all the sectors as markets look to end the week in the red. There are, of course, any number of ongoing risk scenarios for this, but the event that has been singled out as causing the latest swoon is Jay Powell’s comment that a half percent rise in interest rates is ‘on the table’ for the May meeting.
However, given the strength of the energy sector as reflected in the XLE, I thought this would be a good time to consider the charts from a volume price analysis perspective to see whether the sector has reached a technical pause point, or whether a deeper correction is on the horizon. And for this we need to consider the volume price analysis picture in the slower timeframes.
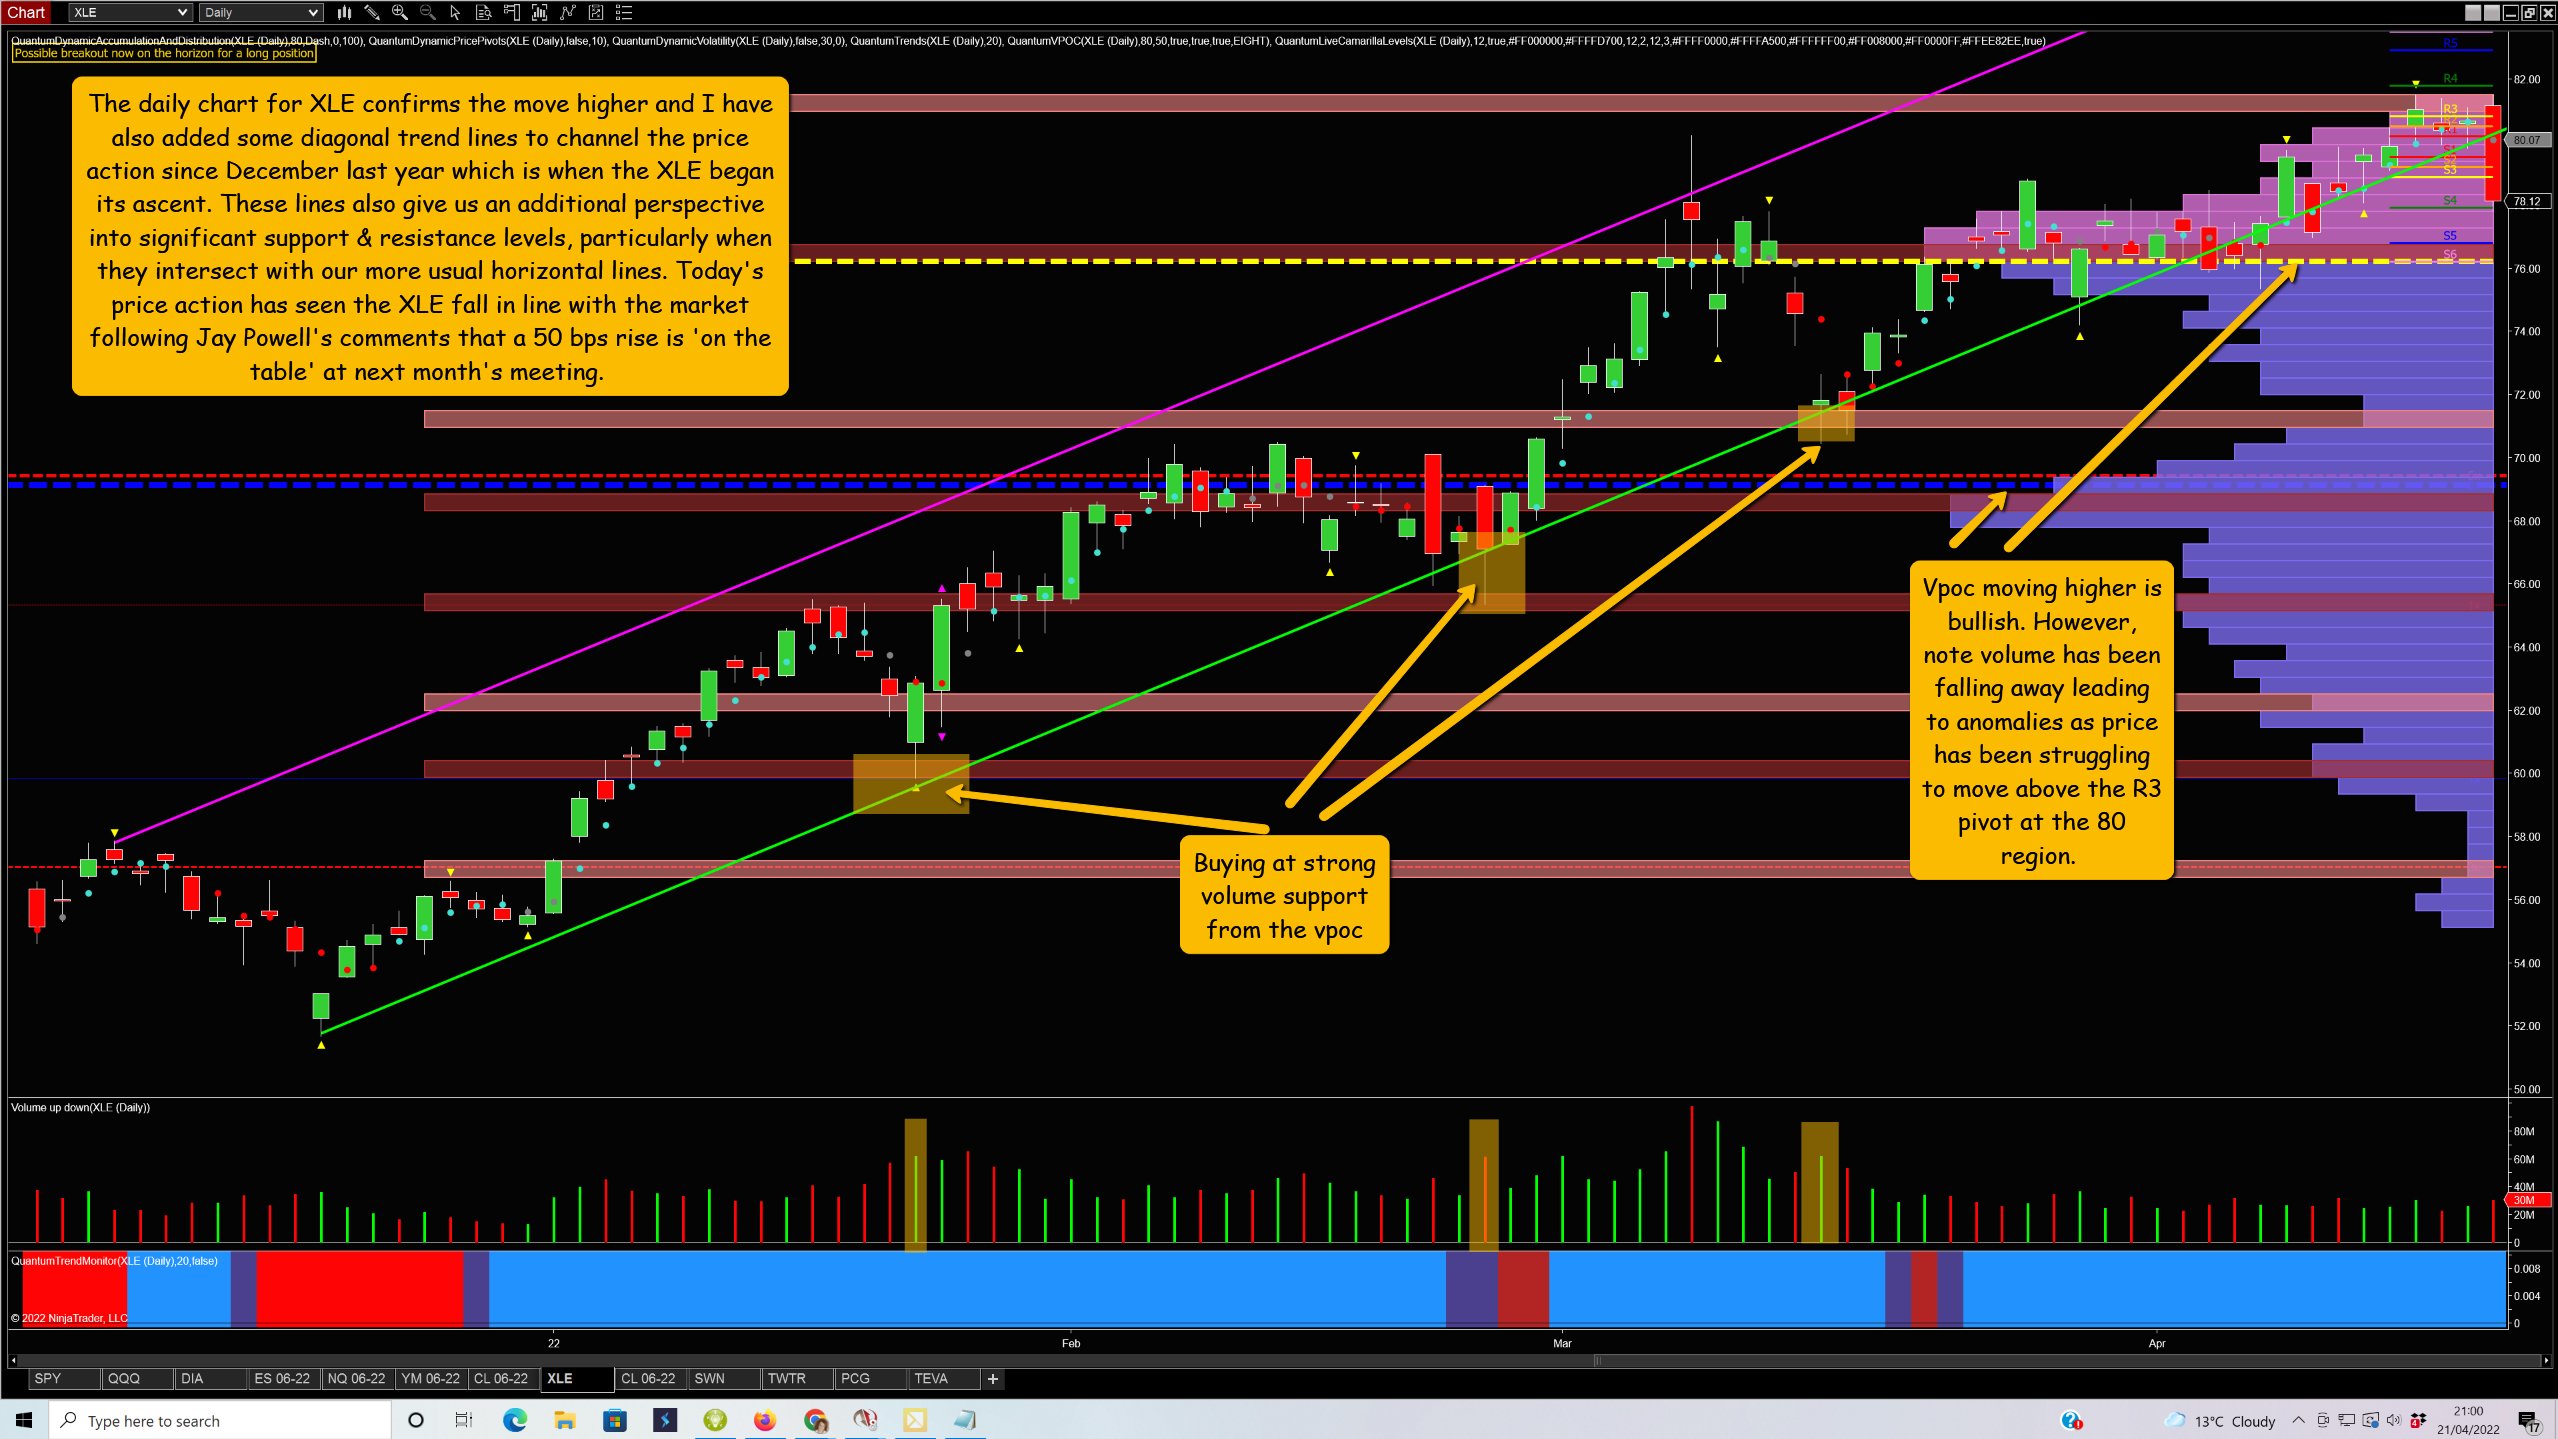
The first chart I want to consider is the daily chart, where we can clearly see the climb higher in the index. I have also drawn in some trend lines, as I wanted to capture the price channel and highlight how volume not only validates the price action, but can also help to confirm whether the trend is likely to continue higher at significant support levels and zones.
The down candle we see on the chart is the result of Jay Powell’s comments, as markets have continued to fall heavily since those comments were made. For the XLE, this has meant the price action has been moving towards the volume point of control, which sits at the 76 region. This is where it has paused at the time of writing, and this also serves as a strong support level.
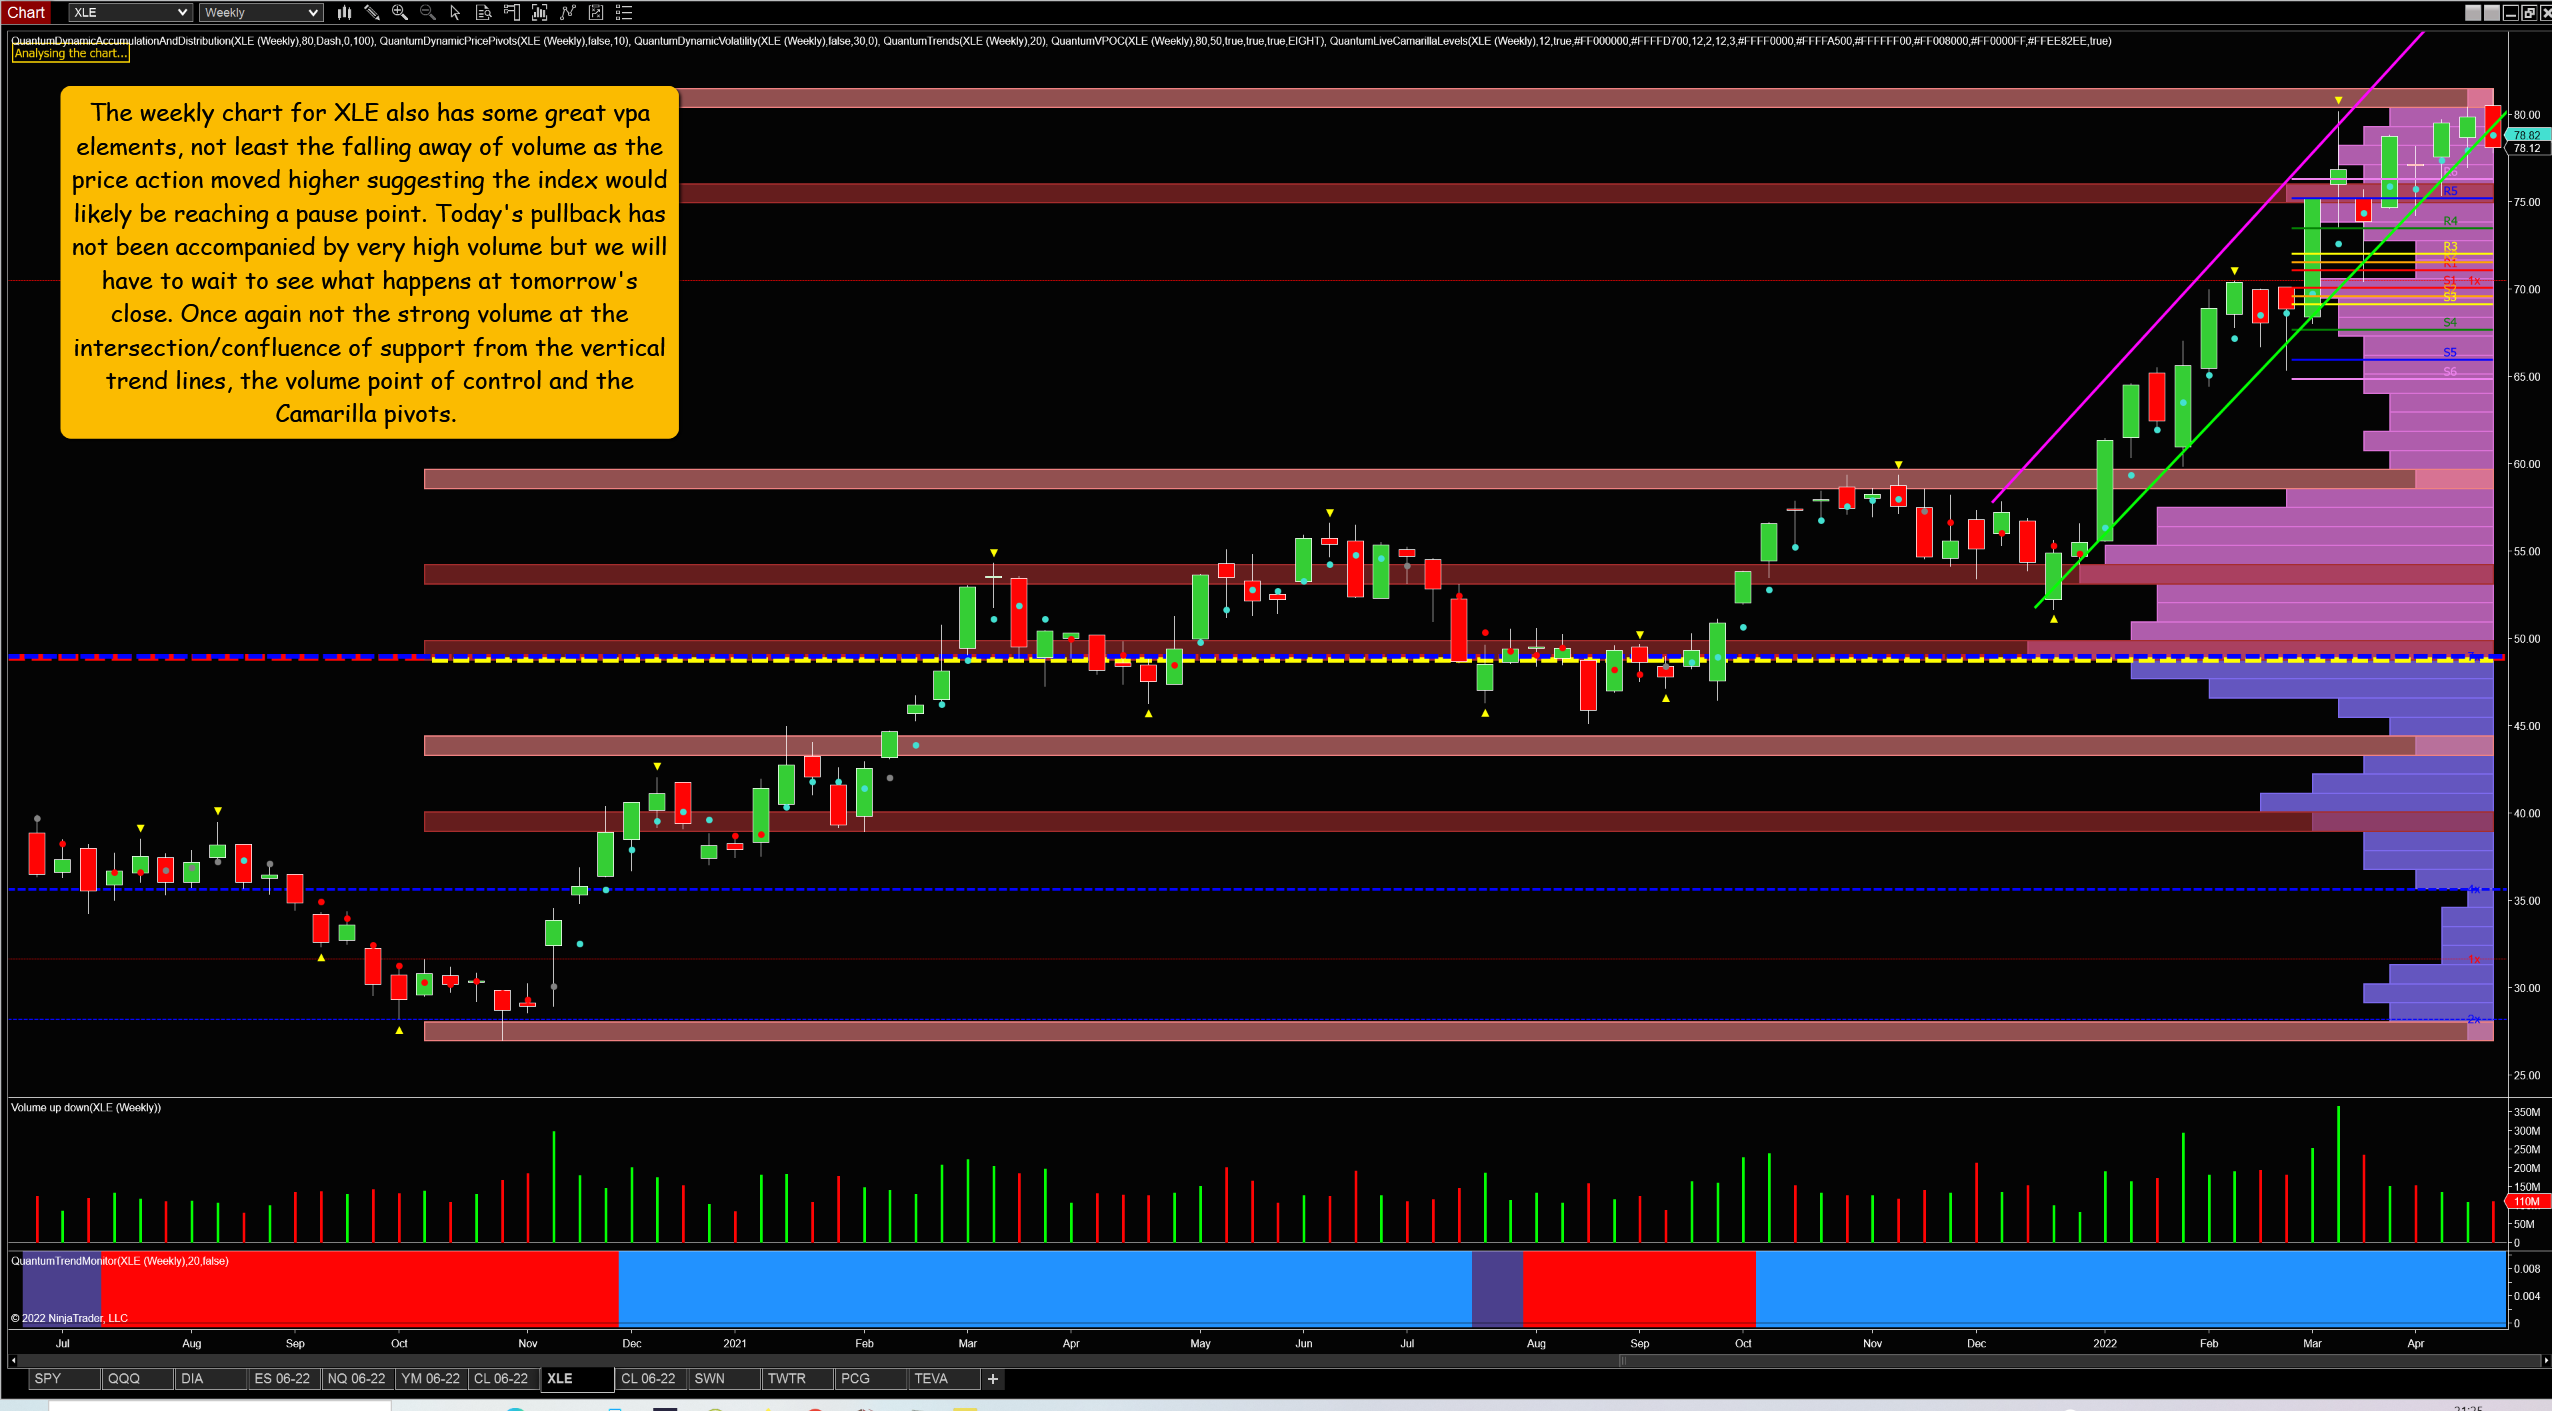
Moving to the weekly chart, the trend higher is even more pronounced. Once again we have strong volume coming in at the intersection/confluence of the trend line, the volume point of control, and the Camarilla pivots, but it will be the volume at the close that will determine whether the current pullback turns into a full-blown reversal.

But it is the monthly chart that is the most interesting from a volume price analysis perspective, which I have annotated accordingly and is self-explanatory. In summary, this is the current technical picture for the XLE, to which we should also add some fundamental points to see if they will influence whether the index breaks high and holds above that obstinate $80 level.
First, is increasing inflation going to keep driving the XLE higher, as the energy sector often does well in an inflationary environment and is also used as a hedge?
Second, given the heavy weighting of oil producers in the XLE, will the proposed increase of supply in May by OPEC along with the release of 1 million barrels a day of oil from the US Strategic Reserve cap or reduce gas and energy costs, thereby easing the inflation burden for consumers?
Third, could the lack of progress higher be due to the idea that traders and investors are simply on the sidelines waiting to see whether this additional supply has the desired effect?
The indicators featured are my own and available from http://www.quantumtrading.com. Charts are courtesy of Ninjatrader.
Disclaimer: Futures, ...
more

