
What Will Impact S&P 500 Trend In Early 2019
2018 could easily be characterized as the year that volatility came back into the market place due to Quantitative Tightening and geopolitical/macro concerns. Asset prices reached record levels in 2017 and through much of 2018, but as the Fed ratcheted higher its rate hikes (4 rate hikes in FY18) the market became increasingly fearful that the FOMC would or had gone too far. When coupled with the lingering and looming affects of an ongoing trade feud between the United States and China, investors fled the equity markets in favor of perceived lower risk bonds and cash.
Volatility Comeback
Volatility (as gauged by the VIX) came back to the markets in a big way in 2018. The VIX was up 230% in 2018! That overstates the rally because when we consider the VIX for the full year, the mean VIX was up 42.7% on the year, from 11.09% in 2017 to 16.64% in 2018. (See table below)
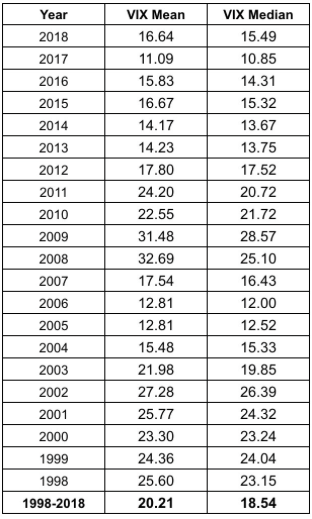
This begs the question as to whether or not we have entered a longer-term volatility regime having a higher median, annual average. This doesn’t necessarily insist that 2019’s mean VIX reading will be greater than that of 2018, but greater than that of 2017 is highly probable.
In the first completed week of New Year trading (FY19), the market has already expressed a high degree of market volatility. “But volatility got crushed in the first week guys?” Yes, the VIX is down substantially from its peak of 36 just a couple of weeks ago and was down some 16% on Friday alone. Having said that, historic volatility (HV), otherwise known as realized market volatility, is much higher than the VIX is giving credit.

Whether we look at HV10, HV20 or HV30, all three historic volatility levels are higher than that of the VIX at present and going into the coming trading week ahead. This demonstrates how large and how violent the market moves have been in the last few trading weeks and just last week alone.
S&P 500 Outlook
The S&P 500 had two consecutive daily moves last week of greater than 2.4%, with Friday finding the S&P 500 closing out the week with a move of nearly 3.5 percent. While a move to the upside and for the whole of the trading week is a welcome sight for investors, the realized market volatility demonstrates the underlying ails of the market. What we have seen of late in the “rip your face off market rallies” is the exact defining characteristics of a bear market or at least an unhealthy market. What investors would rather experience are healthy daily moves of less than 1 percent. The VIX would have to retrench to 16 before such daily moves are found.
Last week’s S&P 500 weekly expected move was $84. We had extreme market moves on at least 2 trading days and in opposite directions, but we still managed to end the trading week within the weekly expected move and up roughly 1% year-to-date.
For this week's trading to come, and on the heels of a volatility crush last Friday, the S&P 500 weekly expected move has greatly declined from the $84 level last week to just $60.
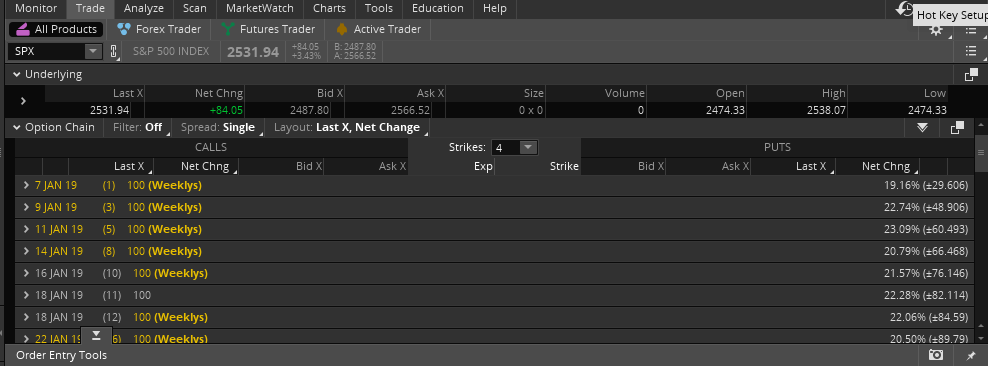
As implied volatility moves lower or higher, the weekly expected moves generally perform in a synchronized fashion.
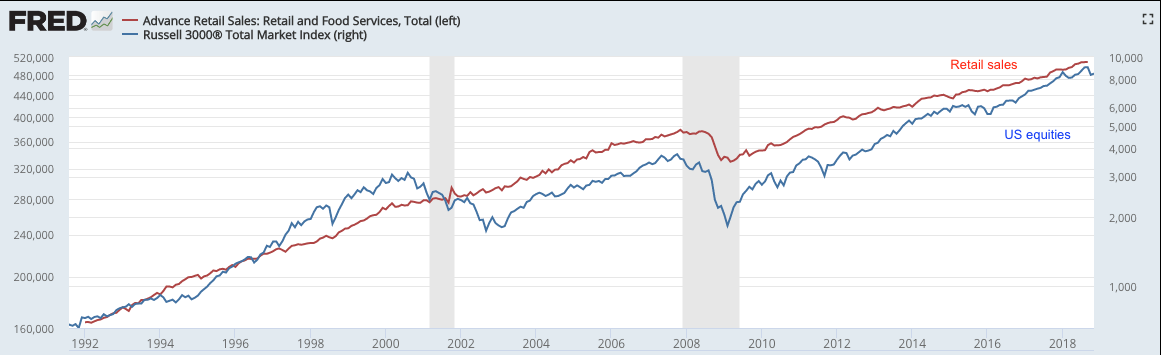
Given the reasons behind the technical breakdown of the market in 2018 and the belief it resulted as a disconnect from the fundamental economy, I believe there is a reasonable probability for the market to finish higher than where it ended for 2018. The highly misleading saying that "the stock market is not the economy" is true on a day-to-day or even month-to-month basis, but over time these two move together. When they diverge, it is normally a function of emotion, whether measured in valuation premiums/discounts or sentiment extremes.
Economic Data Remains Strong
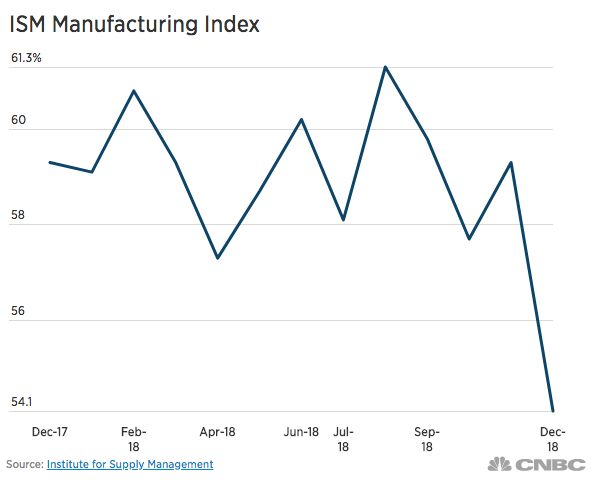
The Institute for Supply Management said its manufacturing index fell to 54.1% last month from 59.3 percent. Economists surveyed by MarketWatch had forecast the index to fall to just 57 percent.
“Comments from the panel reflect continued expanding business strength, but at much lower levels,” said Timothy Fiore, chair of the Institute for Supply Management, in statement. “Demand softened, with the New Orders Index retreating to recent low levels, the Customers’ Inventories Index remaining too low — a positive heading into the first quarter of 2019 — and the Backlog of Orders declining to a zero-expansion level.”
“The manufacturing community continues to expand, but at much lower levels and at a sharp decline from November,” Fiore said. New orders fell to 51.1 in December from 62.1 in November.
The ISM data was worse than forecasted, but demands appropriate reflection. The index had hovered near 60 for the past year and a half before dropping off in December. The chart below shows that even with the recent drop, ISM remains in expansion territory and has seen much lower levels during the economic expansion cycle.
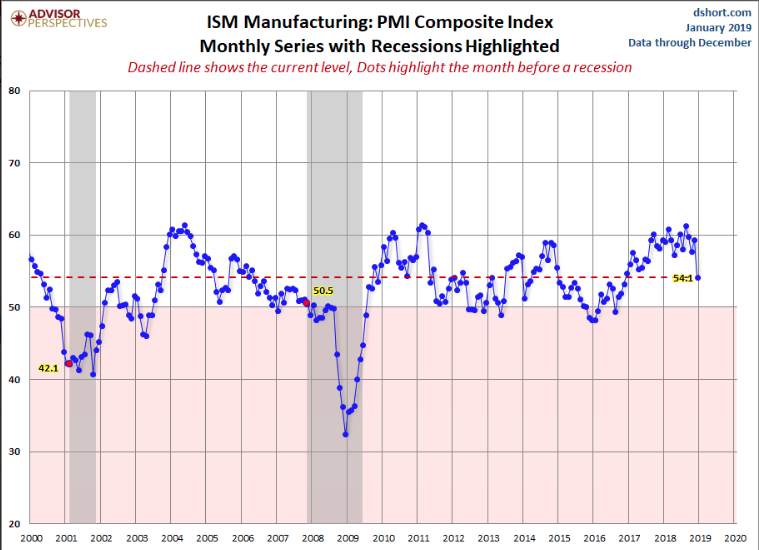
Moreover, the longevity for which the ISM held up above or around the 60-level is rather unprecedented (see chart above) since the turn of the century. When viewed with such context, I don’t believe the ISM data was as dire as the market move portend it to have been.
If Thursday’s ISM data was cause for concern, Friday’s December Nonfarm Payroll report alleviated some of those concerns.
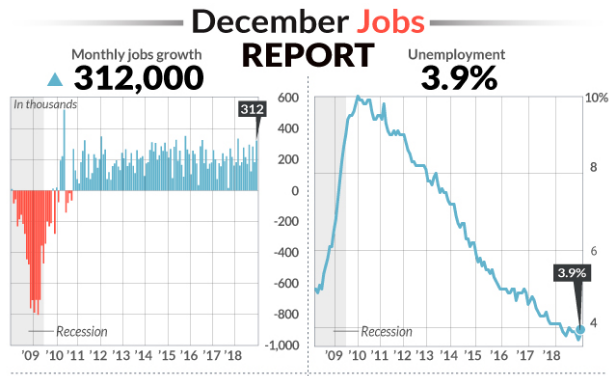
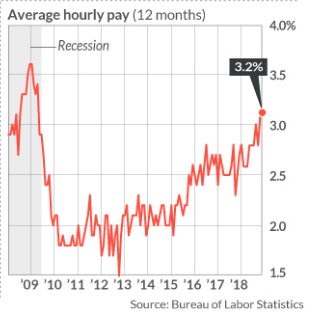
The U.S. gained 312,000 new jobs in December, capping off the biggest increase in hiring in three years. The unemployment rate, meanwhile, rose to 3.9% from a 49-year low of 3.7%. The percentage of working-age Americans in the labor force climbed to a one-and-a-half-year high as more people looked for jobs. That’s usually seen as a good sign since it means people think work is easier to find. The amount of money the average worker earns climbed 11 cents, or 0.4% to $27.48 an hour last month. This was higher than the expected .3% hourly wage growth. What’s more, the increase in pay in the past 12 months rose to 3.2% from 3.1%, matching a post-recession high set back in January of 2018. Employment gains for November and October were also revised up by a combined 58,000.
The U.S. added an average of 254,000 jobs a month in the fourth quarter, the biggest increase since 2016. In the past 12 months, the monthly average has improved to 220,000.
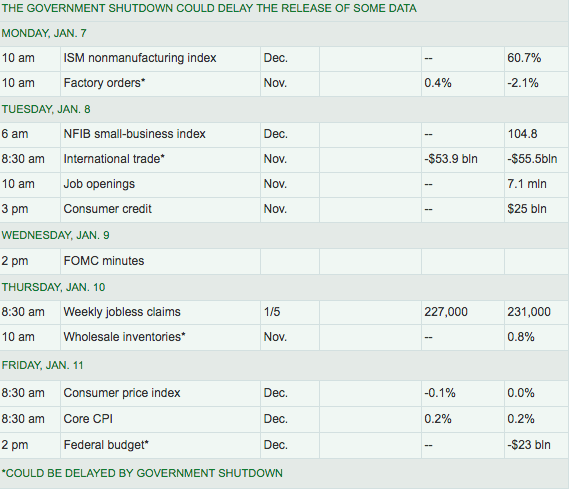
Below is a table of the economic data to be released this week.
Market (S&P 500) Headwinds
Not much has changed in the way of headwinds and tailwinds for the market as we enter the 2nd trading week of the year. The technicals of the market remain terrible and sentiment is also unfavorable, although showing some signs of improving through the American Association of Individual Investors survey.
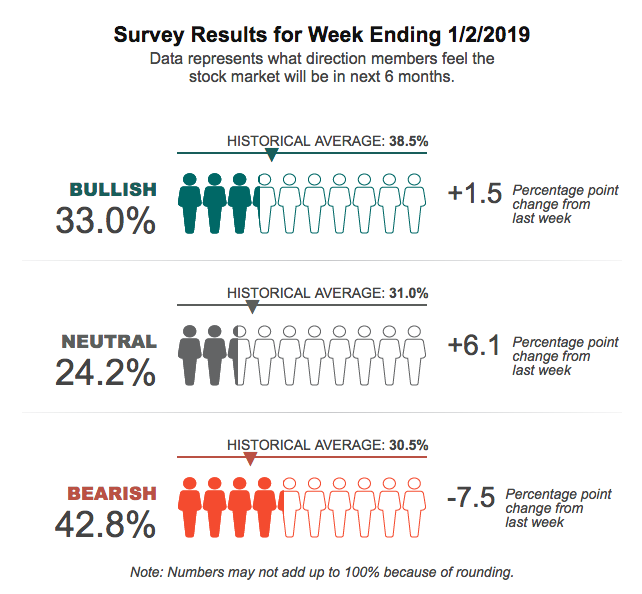
Pessimism remained above 40% for the fourth consecutive week, the longest such stretch since the fall of 2011. In order for the market to sustain upward momentum, sentiment will need to improve further.
I offer and define some of the largest market headwinds in the New Year as follows.
- U.S. Dollar/Crude oil: The U.S. Dollar proved a safe haven for investors in 2018, weighing on sales and earnings. The Dollar Index remains elevated, although it has come down in recent weeks. The issue that still remains a headwind for corporations can be seen in the 1-year chart of the Dollar Index.
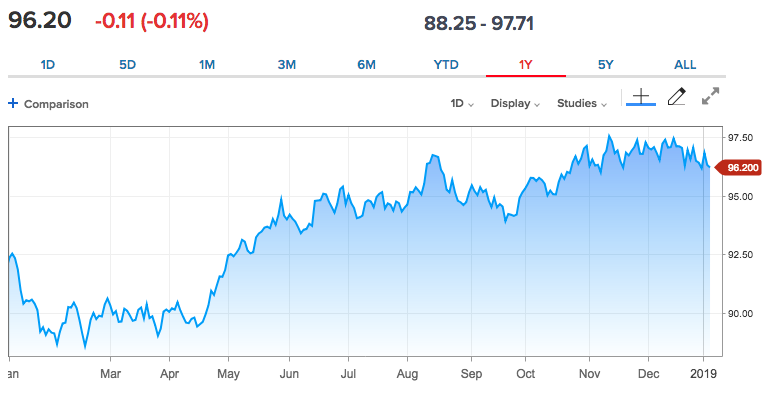
- When corporations report earnings in January, they will offer guidance that will likely reflect the YOY change in the Dollar Index. The higher the Dollar on a YOY basis, the more pressure on sales and earnings for multi-national corporations. Having said that, if the Dollar Index should decline further through 2019, back half 2019 comparisons become more manageable for corporations.
- S./China trade feud: I remain of the opinion that until a trade deal is conceived, corporations will come under pressure from tariffs and the “plague of uncertainty”. Moreover, the trade feud has also played a significant role in the devaluation of the Yuan and steepened the slowdown in the Chinese economy. China and the United States will hold vice ministerial level trade talks in Beijing on Jan 7-8. I also believe there will be headlines from these talks this coming week. Ultimately, we also believe there is great pressure on the two nations to come to an agreement, as the two economic powers are dependent on each other for sustainable global growth.
- FOMC: The Fed remains a headwind as they are continuing to tighten monetary conditions through the balance sheet run-off activity. At the current pace of selling Treasuries, ($50bn monthly), the Fed is effectively tightening fiscal conditions and/or effectively raising rates roughly .25% basis points per quarter, according to many economists. However, the Fed has slanted more dovish with recent messaging that suggests future rate hikes are “on hold”. Investors trust the Fed will not raise rates near term, but will only be able to verify the dovish stance through upcoming FOMC meetings.
- Government Shutdown: The recent and ongoing partial government shutdown has extended into its 3rd Come January 15th, federal employees will not receive paychecks for the first time during the shutdown period. It is increasingly incumbent upon the parties involved to find resolution and reopen the government prior to this occurrence. If the government should not reopen in January, it will likely weigh on GDP and serve to undermine economic conditions and filter negatively into the equity markets.
The key takeaway from all the aforementioned headwinds to the market and economy is that each one is manmade and thus reliant on manmade resolutions. The U.S. Dollar strength is a negative feedback correlation from the ongoing trade war and FOMC tightening cycle. Finding resolutions to the headwinds can resolve the Dollar’s strength.
S&P 500 Corporate Earnings
Earnings drive markets over time. Although earnings will prove to have grown 20% or greater in 2018, the market declined by roughly 6.5% for the calendar year. This is an anomaly for any expansion cycle and reflects the uncertainty surrounding future earnings. Since September 30, 2018, the earnings estimates for 2019 have dropped significantly.
This sounds like a net negative, but examples why the market dropped precipitously during the 4th Quarter of 2018. The market was pricing in slower earnings growth. With the drop in the estimates and the market having seemingly been priced in, we’ll need to hear what companies project in their FY19 guidance to further the broader market outlook for the year. Once guidance is better understood, analysts and investors can better position capital.
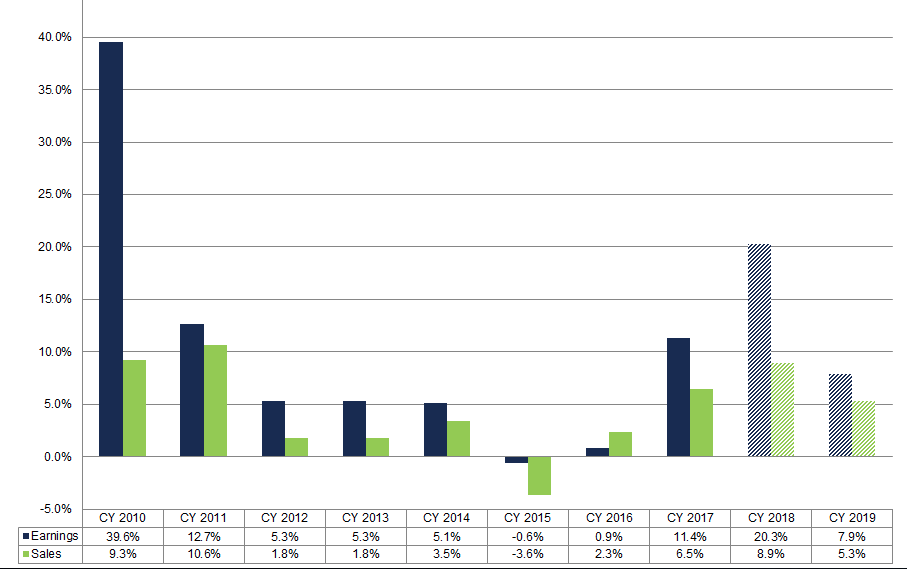
As depicted in the chart above, FactSet forecasts earnings to grow roughly 7.9% in 2018 with revenue growth of 5.3 percent. This represents a slowdown from the forecasted earnings growth of 22-23% and revenue growth of 8.9% in 2018. The good news is that earnings and revenue forecasts have fallen ahead of earnings season, but we expect cautious guidance from S&P 500 companies.
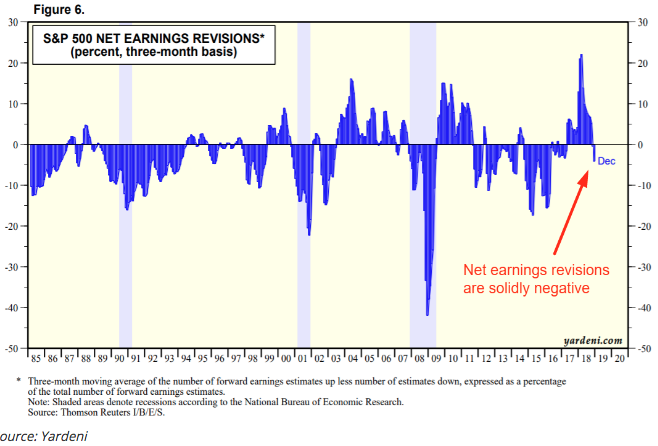
As depicted in the chart above, the bad news is that net earnings revisions are solidly negative for the first time in 2 years.
Analysts’ Comments & Broader Takeaways
Only one week into the New Year and some analysts and strategists are seeing trouble for the market on the horizon. Tobias Levkovich, chief U.S. equity strategist at Citi, last week cut his 2019 S&P 500 forecast, blaming the selloff that has erased roughly $5 trillion in market capitalization since September.
“While one predictor still suggests that our prior 3,100 target is achievable, most of the other factors do not and we believe that a 2,850 S&P 500 target is more reasonable after the plunge in equity prices the last three months,” he wrote in a report."
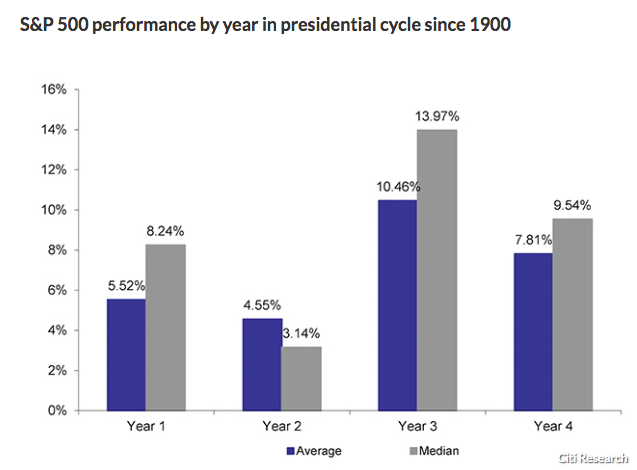
In truth, his new target does seem more reasonable and still represents significant market upside for 2019. What it doesn’t represent is a full return of the bull market. But Levkovich also suggests the fact that it is the third year of a presidential cycle may work in investors’ favor, as the graph below illustrates.
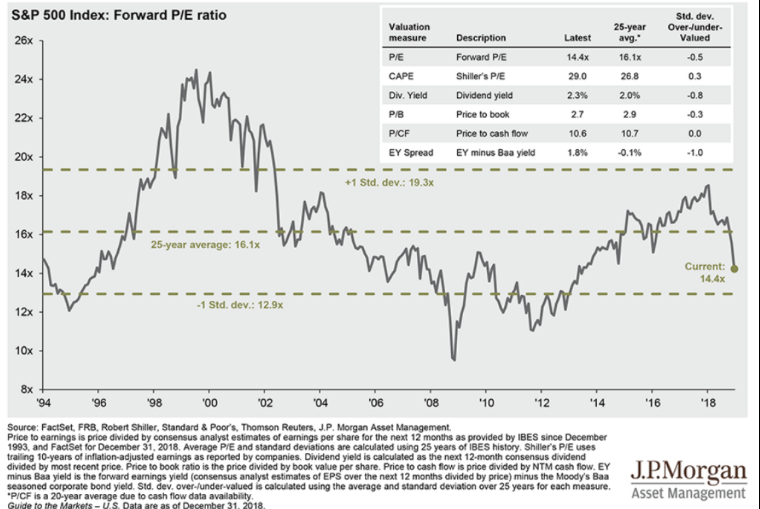
“Moreover, at current inflation levels, an 18x P/E ratio is quite typical. Our normalized earnings yield gap analysis also calls for significant share price appreciation in the next 12 months with an 89% probability score. Nothing is guaranteed, but the data suggest that we should be buying into current weakness.”
The S&P 500 is currently trading below its 5,10 and 25-year Forward Looking Multiple. Cheap?
While that may seem like an opportunity is at hand, earnings will lend more clarity in the coming weeks. The current bear market situation is rather unique, somewhat akin to the 1987 October market crash in that it disconnects from the economic fundamentals. We usually find bear markets occurring during a recession (2 consecutive quarters of negative GDP growth) and having some semblance of a credit crisis. Despite media rhetoric, we’ve not seen either set of conditions satisfied to suggest the technical bear market has staying power. High yield spreads have not blown out during the current market correction, and default rates remain well below average. This part of the bond market is not signaling trouble.
According to Tony Dwyer, chief market strategist at Canaccord Genuity, human nature based market crashes that happen outside of a credit crisis driven recession like 1987, 1997, 2011 and 2018 are very consistent: (1) there is a sharp reflex rally following the initial low, (2) then a retest, and then (3) a move to new highs prior to the next credit crisis.

“The market will be down again 20 percent from peak,” the firm’s chief market strategist said Monday on CNBC’s “Trading Nation. ” “The history of a nonrecession, post-crash environment is: You get a sharp rally off the low for a couple of weeks, four to five weeks later you get a retest, and then you move to new highs.”
Volatility & SPX Trading
Investors, strategist and analysts have very binary outlooks for the market in 2019. Finom Group believes that we are trending toward the peak of the economic and market cycle and as such, elevated volatility is likely the market condition going forward.
While the headwinds for the S&P 500 may find resolution in the first half of 2019, there is a growing belief that President Trump will come under increasing pressure from the majority Democrat Congress. Additionally, the looming Mueller investigation is ongoing and not likely to be resolved without further headlines that impact the Trump White House negatively and given the already negative headlines produced in 2018. Even if the current trade feuds and government shutdown are resolved near term, investors should consider the likelihood of yet another manmade political crises thereafter.


