
Weekly Commitment Of Traders: Futures, Hedge Fund Positions
Following futures positions of non-commercials are as of May 7, 2019.
10-year note: Currently net short 330.6k, up 42.6k.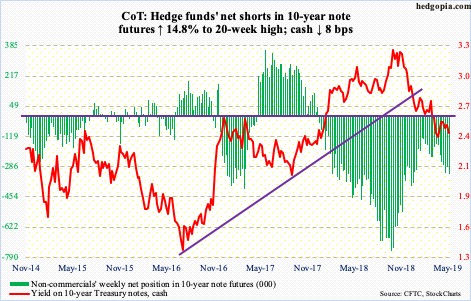
The 10-year Treasury yield (2.46 percent) fell eight basis points this week. Not surprising considering it was a risk-off week in equities. TLT (iShares 20+ year Treasury bond ETF) rallied 0.9 percent. The ETF has now rallied for four straight weeks. During this, bond vigilantes learned that the US economy expanded 3.2 percent in 1Q19 and that April produced 263,000 non-farm jobs – both better than expected – among other data points. Yet, bonds keep getting bid up.
Most recently, this has been the case since the 10-year rate retreated from 2.61 percent on April 17. Support-turned-resistance at 2.62 percent is a crucial level going back a decade. Until this is decisively conquered, non-commercials who have built up decent-size net shorts in 10-year-note futures risk getting squeezed – again – at some point.
30-year bond: Currently net short 35k, down 3k.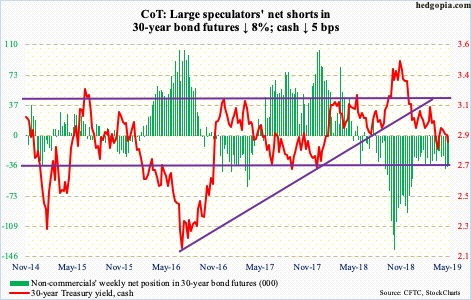
Major economic releases next week are as follows.
The NFIB optimism index for April comes out Tuesday. Small-business optimism inched up one-tenth of a point month-over-month in March to 101.8. Sentiment has remained north of 100 for 28 straight months, including last August’s record 108.8.
Wednesday brings retail sales (April), industrial production (April), Treasury International Capital System data (March) and the NAHB housing market index (May).
In the 12 months to March, retail sales jumped 3.6 percent to a seasonally adjusted annual rate of $514.1 billion – a record.
Capacity utilization in March rose 0.8 percent year-over-year to 78.8 percent. This was the slowest y/y advance in 25 months.
Foreigners net-sold $10.7 billion worth of US equities in February, for a 12-month total of minus $205.1 billion – a record.
Homebuilder optimism edged up a point m/m in April to 63 –a six-month high. In December 2017, sentiment reached 74 – the highest since July 1999.
April’s housing starts are due out Thursday. March starts inched down 0.3 percent m/m to 1.14 million units (SAAR) – a 22-month low.
The University of Michigan’s consumer sentiment index for May (preliminary) is scheduled for Friday. Consumer sentiment in April dropped 1.2 points m/m to 97.2. In March last year, sentiment reached 101.4, which was the highest since January 2004.
Crude oil: Currently net long 599.9k, down 32.3k.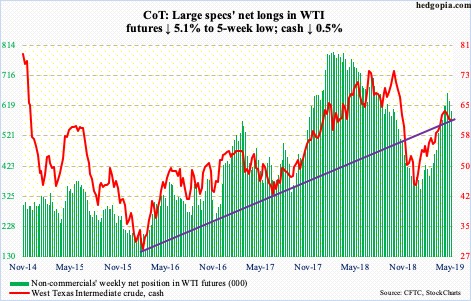
US crude production in the week to May 3 decreased 100,000 barrels per day from prior week’s record 10.3 million bpd. Crude imports fell too – by 721,000 bpd to 6.7 mbpd. As did stocks of crude, gasoline and distillates – down four million barrels, 596,000 barrels and 159,000 barrels to 466.6 million barrels, 226.1 million barrels and 125.6 million barrels, respectively. Refinery utilization inched down three-tenths of a percentage point to 88.9 percent.
Wednesday, the day the EIA report was published, the cash ($61.66/barrel) rallied 1.2 percent. It found support at the daily lower Bollinger band as well as a confluence of the 50- and 200-day moving averages. A golden cross formed in that session. On the daily, the crude can rally near term. On the weekly, however, momentum is down. Three weeks ago, WTI peaked at $66.60. Immediately ahead, right above lie the now-falling 10- and 20-day, and above that short-term resistance at $64.70s.
E-mini S&P 500: Currently net long 96.1k, up 34.8k.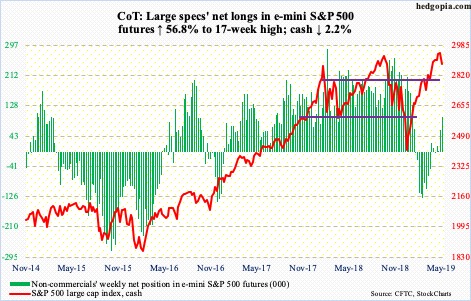
Since peaking at $3.11 trillion early March, US money-market assets fell by $70 billion in the next six weeks, igniting bulls’ hopes that a trend had begun and that this would provide a tailwind to stocks. Things did not quite turn out that way. Since the mid-April low, these assets have gone up by $41 billion to $3.08 trillion (courtesy of ICI). The latest figure is as of Wednesday. In the week ended the same day, US-based equity funds lost $12.7 billion (courtesy of Lipper). In the same week, SPY (SPDR S&P 500 ETF), VOO (Vanguard S&P 500 ETF) and IVV (iShares core S&P 500 ETF) lost a combined $6.9 billion (courtesy of ETF.com). The point is, money is not moving into equities.
On May 1, the cash (2881.40) rallied to a fresh high of 2954.13 but was not able to sustain the momentum. By Friday, it fell to 2825.39 intraday. This nearly was a retest of the mid-March breakout at 2800-plus. Bulls pounced on the opportunity. Friday ended up 0.4 percent, reversing an earlier 1.6-percent drop. The 50-day has been defended. Bulls have an opportunity to build on this reversal next week.
Euro: Currently net short 106.1k, up 561.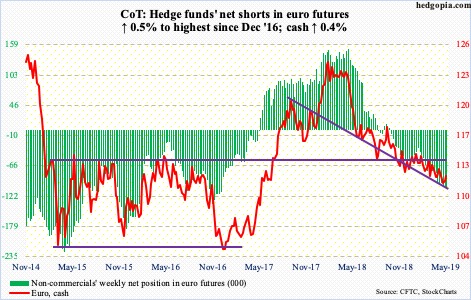
The European Commission, the European Union’s executive arm, Tuesday cuts its eurozone growth forecast this year from 1.3 percent to 1.2 percent. The cash ($112.32) essentially yawned. That economic growth has softened in the 19 countries using the euro is no news. The reason why the ECB made a dovish turn in March, and why Mario Draghi, ECB president, maintains an overall cautious tone.
The euro accordingly has not been able to lift off of the malaise it has been in the past several months. It peaked in January last year at $125.37, then dropping to $111.12 11 sessions ago. The 50-day continues to drop, but shorter-term averages are trying to flatten out/turn up. Since the late-April low, higher lows have formed. The persistent pattern of lower highs gets broken if the currency takes out the high eight sessions ago of $112.65. The weekly is trying hard to rally.
Gold: Currently net long 75.4k, up 9.2k.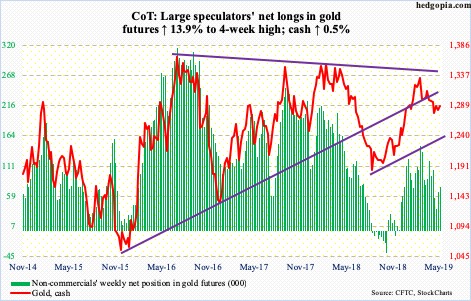
Gold did not quite benefit from risk-off sentiment in equities this week. The cash ($1,287.40/ounce) continued to linger around the 10- and 20-day, which are converging. Wednesday, the metal rallied to $1,292.80 but only to get denied at the 50-day.
From gold bugs’ perspective, the good thing is that the metal continues to cling on to $1,280s. Plus, the lows of $1,260s over the last three weeks are intact. Non-commercials have been adding to net longs. Bulls would like flows to improve, which continued to disappoint this week.
In the week to Wednesday, GLD (SPDR gold ETF) and IAU (iShares gold trust) respectively lost $277 million and $247 million (courtesy of ETF.com). In the prior three, they collectively lost $754 million.
Nasdaq 100 index (mini): Currently net short 9.3k, up 6.9k.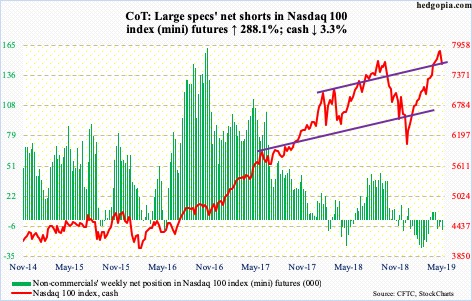
QQQ (Invesco QQQ trust) lost $2.6 billion in the week ended Wednesday. This was the highest weekly withdrawal since early this year (courtesy of ETF.com).
The cash (7586.53) dropped 3.3 percent this week. Prior to this, the Nasdaq 100 only had one down week in 19. After this extended run, last week produced a weekly hanging man. Bulls this week were unable to defend support at 7700, which is also where trend-line support from late December lied.
Both Thursday and Friday, the 50-day was defended. It is possible rallies get sold at 7700. The weekly remains grossly overbought. Unwinding will take a while.
Russell 2000 mini-index: Currently net short 9.5k, down 7.3k.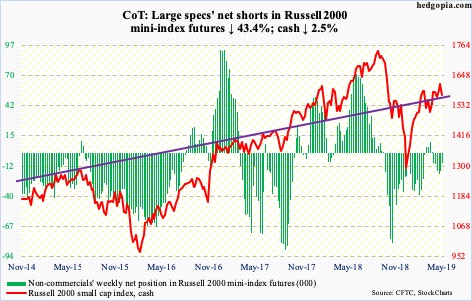
There was an air of excitement among small-cap bulls Friday last week when the cash (1572.99) rallied two percent to end the week slightly past or right at resistance just north of 1600. This ceiling goes back to January last year, and once again it proved tough to crack. By Friday, the Russell 2000 fell to 1546.14 but only to reverse hard. Thursday, too, witnessed strong intraday reversal. Both those sessions produced inverted hammers. That said, it is equally possible these are hanging man candles. Time will tell. In the latter scenario, weekly momentum indicators – deeply overbought – have just begun unwinding.
US Dollar Index: Currently net long 28.2k, down 716.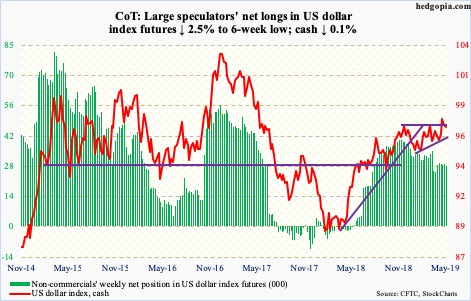
Resistance at 97.50s is proving tough to crack, having failed at that level several times this week. After dropping to 93.39 last September, the cash (97.12) consistently made higher lows, even as rally attempts were getting denied at 97-97.50. This resulted in an ascending triangle, which can be a continuation pattern. The US dollar index bottomed early last year around 88. But for this formation to complete, bulls need to break through that resistance, which increasingly looks like a low-probability scenario right now.
VIX: Currently net short 150.3k, down 30.1k.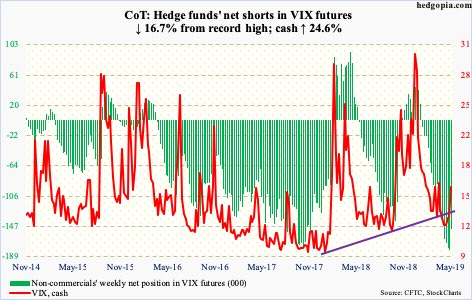
May is only one-third of the way through, and volatility has offered a little something for both bulls and bears. The cash (16.04) jumped 3.17 points this week. Through Thursday’s intraday high of 23.38, it was up 10.51 points! But volatility bulls were not able to hang on to all those gains, resulting in a weekly candle with a long wick.
Several times in the past, VIX has tended to sell off after a spike reversal. Things could unfold similarly near term. The 50-day lies at 14.15. Medium-term, however, there is plenty of room for VIX to continue higher. The weekly MACD is on the verge of a bullish crossover.
Non-commercials this week cut back their record net shorts. There is a long way to go before these massive holdings get unwound.


