
Weekly Charts Of Key ETFs
It’s the weekend so here’s a summary of the weekly view of the modern family with a Real Motion chart.
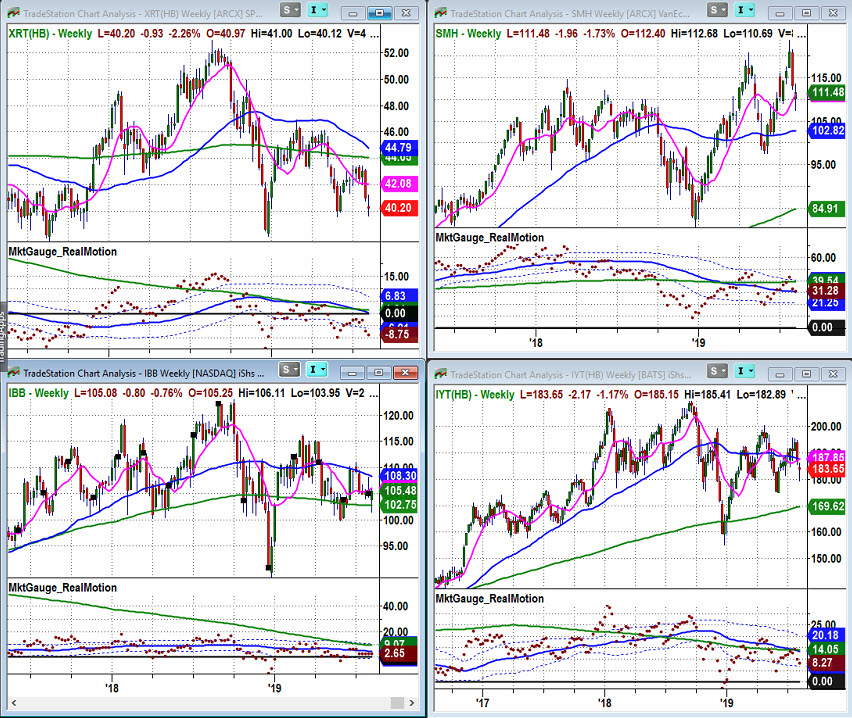
XRT is in a distribution phase and compressing between the 200-week WMA and $40. A breakout in any direction is worth noting.
SMH continues to be the leading group and a trade above last week’s high could be the beginning of the next leg up.
IBB is coiling between its 50 and 200 WMA.
IYT is sitting at a very pivotal level of 180.
KRE is bouncing off its very important level of 50.
IWM is stuck between 145 and 160.

ETF Levels:
S&P 500 (SPY) Consolidation day right under 50 DMA. Support at Thursday’s low, 289. Big support area is 280 to 277.70 (the 200 DMA). Resistance at 295.
Russell 2000 (IWM) Straddling the 200-DMA. Support at Thursday’s low, 150. Next big support is 145.30. Resistance at 50 DMA 153.40
Dow (DIA) Support at Thursday’s low, 260.58. Next support levels are 252.50 and 247. Resistance at 50 DMA around 265.
Nasdaq (QQQ) Straddling 50 DMA. Support at Thursday’s low, 184.57 Swing low is at a trendline from the December 2018 low. Resistance at 190.70.
KRE (Regional Banks) Support around 50.75. Support at swing low, 49.40 and 49.00. Big resistance at 52, then at 50 DMA, 52.80. Resistance at 52 then 50 DMA around 53.
SMH (Semiconductors) Key support at 110.64. Resistance at 116.
IYT (Transportation) Support at 182 area, then at swing low at 179.20. Could rally if clears 186 until it hits big Resistance at 191.
IBB (Biotechnology) Support at 104 which has been pivotal since April. Looks interesting if it can close over 107.
XRT (Retail) Big down day without the market’s bounce. Support area at 40.30-40.00. Major resistance around 42.
Disclosure: None.


