
Triple Q Looking Good
Summary
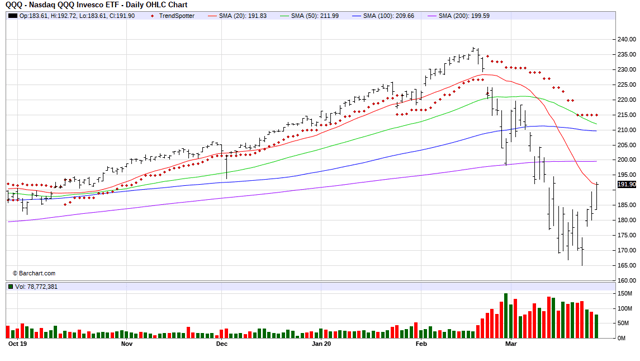
- QQQ closed above its 20 DMA.
- Closed 16.35% above its recent low.
- Buy in small.
Each day Barchart publishes on the Stock Market Momentum & Daily Stock Activty page the following table:
Market Performance Indicator
Barchart Market Momentum Index (BCMM) [+5.98%] is an exclusive index used as an indicator of change in overall markets. It reflects the movement of stocks who fit the following criteria: must have current SEC filings, must have traded for a minimum of 6-months, and must be trading above $2.
MARKET AVERAGE
The percentage of stocks in BCMM above their individual Moving Average per period.
| 5-Day MA | 20-Day MA | 50-Day MA | 100-Day MA | 150-Day MA | 200-Day MA | |
|---|---|---|---|---|---|---|
| Today | 93.81% | 27.68% | 5.70% | 7.02% | 9.40% | 10.75% |
| Yesterday | 81.66% | 11.67% | 3.77% | 5.04% | 6.73% | 7.71% |
| Last Week | 31.65% | 4.30% | 2.85% | 3.69% | 5.12% | 6.13% |
| Last Month | 5.04% | 7.24% | 13.66% | 23.52% | 28.91% | 31.81% |
I will buy back into the the market when this page shows that 50% of the stocks are trading above their 20 day moving average in a 25% increment. I will buy another 25% increment when 50% of the stocks are selling above their 50 day moving average and then again when the same is true for 50% of the stocks trading above their 100 and 150 day moving averages. I will be setting my stop losses at the 200 day moving average and wait for the time that I can begin again to believe that the data has some reliable predictability for individual stocks
Here is a chart of the NASDAQ 100 ETF (QQQ) and I will use it and the table above to be my rational guide to getting back in:
(Click on image to enlarge)
This may not work for all of you, but I thought I would share the method that I'm comfortable with.
Be careful. Be rational.
Disclosure: None.


