
The Week's Commitment Of Traders: Non-Commercial Positions, Futures
Following futures positions of non-commercials are as of September 17, 2019.
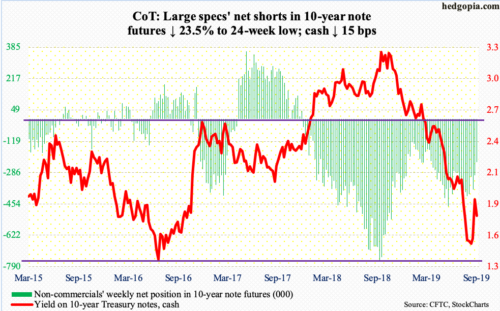
10-year note: Currently net short 230k, down 70.5k.
In the interbank lending market, there were two developments this week. The Fed cut its policy rate by 25 basis points – its second since July – to a range of 175 to 200 basis points. This was expected. At the same time, there was stress in the funding market, with overnight borrowing costs soaring to 10 percent Tuesday. This was unexpected.
Several times beginning Tuesday, the New York Fed conducted overnight repo, injecting billions. In a repo operation, the Fed lends cash to primary dealers (24) in exchange for eligible collateral such as Treasury bonds or mortgage-backed securities. This calmed the markets.
The bigger question is, why did the market gum up?
US banks’ excess reserves have been more than cut in half in five years – $1.3 trillion currently versus $2.7 trillion in September 2014. The federal deficit is nearing a $1 trillion run rate. Concurrently, the Fed has been shrinking its balance sheet, with SOMA (system open market account) holdings down from $4.3 trillion in April 2017 to $3.6 trillion now. When it is all said and done, the stress – and the Fed’s response to it – may just be a prelude to what is to come in quarters to come, which is, expansion – once again – of the Fed’s balance sheet.
30-year bond: Currently net short 46.2k, down 5.5k.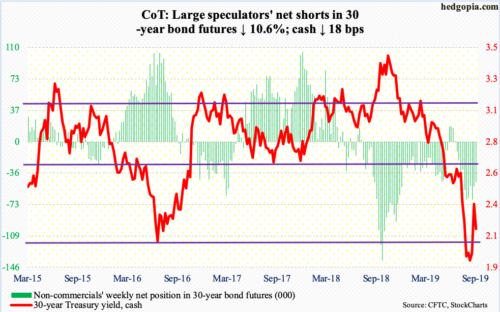
Major economic releases next week are as follows.
The S&P Case-Shiller home-price index (July) is due out Tuesday. Nationally, home prices rose 3.1 percent year-over-year in June, which was the lowest growth rate since September 2012.
New home sales (August) are scheduled for Wednesday. Sales in July fell 12.8 percent month-over-month to a seasonally adjusted annual rate of 635,000 units. June’s 728,000 was the cycle high.
Thursday brings GDP (2Q19, third and final) and corporate profits (2Q19, revised).
The second estimate showed real GDP grew at a two percent rate in 2Q19, slower than 3.1 percent in 1Q19.
Preliminarily, corporate profits with inventory valuation and capital consumption adjustments rose 2.7 percent y/y to $2.11 trillion (SAAR). The cycle high $2.19 trillion was reached in 3Q14.
Durable goods orders (August), personal income and spending (August) and the University of Michigan’s consumer sentiment index (September, final) are on tap Friday.
Orders for non-defense capital goods ex-aircraft – proxy for business plans for capex – contracted 0.56 percent y/y to $69.6 billion (SAAR). This is the first y/y decline in 32 months.
In the 12 months to July, core PCE – the Fed’s favorite measure of consumer inflation – increased 1.58 percent. The Fed has a two percent objective.
Preliminarily, September consumer sentiment increased 2.2 points m/m to 92. The 101.4 reading hit in March last year was the highest since January 2004.
WTI crude oil: Currently net long 591.5k, up 7.7k.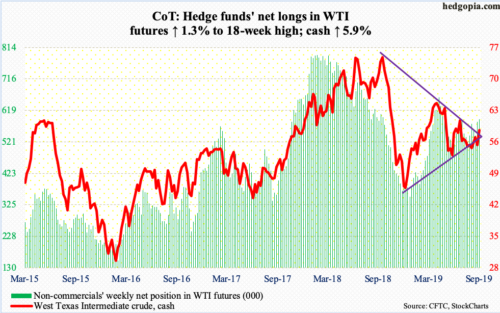
The months-long wedge in the cash ($58.09/barrel) was resolved to the upside Monday when it shot up 14.7 percent in response to the drone attack on Saudi Arabia’s Aramco’s oil-processing facility. Wednesday, President Donald Trump ordered increased sanctions on Iran instead of military action. Then, Saudi Arabia said oil production would return to normal by the end of the month, which was sooner than markets earlier feared. In the crosscurrents of these bits and pieces, WTI pulled back from Monday’s intraday high of $63.38. Wednesday’s low of $57.58 found support at the top of the broken wedge. Should the crude drop back into the wedge, there is trend-line support from last December at $55.50.
The EIA report for the week of September 13 was mostly neutral to negative. For the three weeks in a row, US crude production remained unchanged at 12.4 million barrels per day. Crude imports increased 325,000 bpd to 7.1 mbpd. Stocks of crude, gasoline and distillates rose 1.1 million barrels, 781,000 barrels and 437,000 barrels to 417.1 million barrels, 229.7 million barrels and 136.7 million barrels, in that order. Refinery utilization fell 3.9 percentage points to 91.2 percent.
E-mini S&P 500: Currently net short 11.7k, down 4.7k.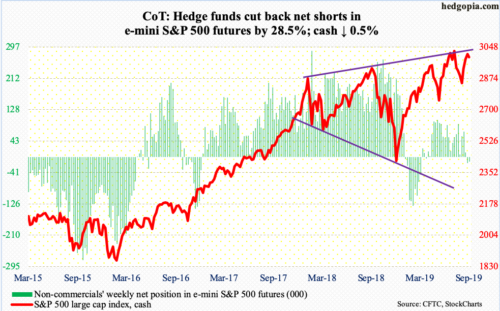
Flows into US-based equity funds were positive for the second straight week – $6 billion in the week to Wednesday versus $6.8 billion in the prior week (courtesy of Lipper). In the same week, SPY (SPDR S&P 500 ETF), VOO (Vanguard S&P 500 ETF) and IVV (iShares Core S&P 500 ETF) attracted a combined $2.4 billion, versus $8.2 billion in the prior week (courtesy of ETF.com).
Not much progress was made in the week – down 0.5 percent, after three positive weeks. Last week, the cash (2992.07) retreated from 3020.74 in a long-legged doji session Thursday. Thursday this week, it pulled back after printing 3021.99 intraday. This was preceded by Wednesday’s potentially bearish hanging man, with the session low finding support at a rising trend line from last December. Besides this trend line, horizontal support at 2940s is the next one to watch near term.
In the meantime, foreigners purchased $50.7 billion in US stocks in June and July. This followed 13 straight weeks of net selling. Too soon to say if this represents a shift in sentiment, but if it is, it is coming at an interesting juncture, with several valuation metrics stretched, including the ratio of S&P 500 market cap to nominal GDP.
Euro: Currently net short 68.6k, up 18.7k.
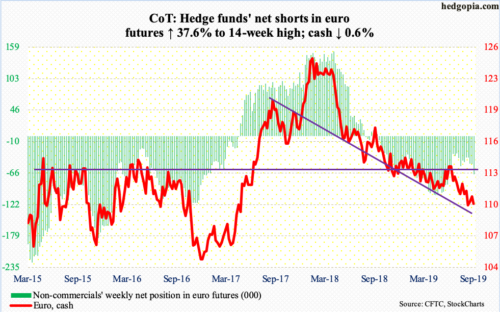
Listless action continues in the cash ($110.07). Having dropped to $109.20s in the past couple of weeks, the euro remained well above that low this week. That said, nearest resistance at $111 was not tested, which bulls need to recapture to build short-term momentum.
Gold: Currently net long 282.6k, up 12.9k.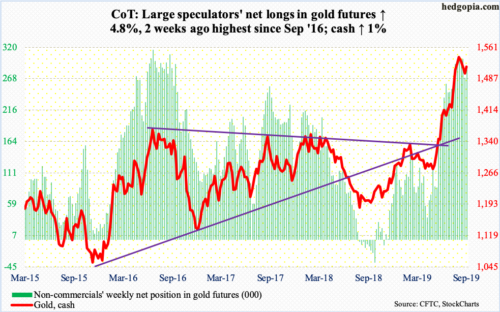
In the week to Wednesday, GLD (SPDR Gold ETF) and IAU (iShares Gold Trust) gained $97 million and $54 million respectively (courtesy of ETF.com).
The cash ($1,515.10/ounce) for several sessions went sideways just above the 50-day ($1,489.13). There is room for the daily to rally.
Earlier on the 4th, gold tagged $1,566.20 intraday. Before that, it struggled in the $1,540s-50s for three weeks. This is an important price point. In September 2011, the yellow metal peaked at record $1,923.70 and began to unravel after it lost $1,540s-50s. As well, a 61.8-percent Fibonacci retracement of the September 2011-December 2015 decline lies at $1,588.
Nasdaq 100 index (mini): Currently net long 34.8k, up 7.9k.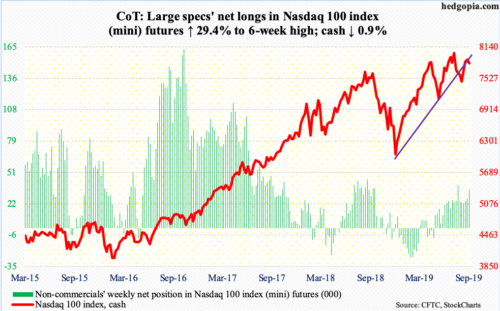
On July 26, the cash (7823.55) made an all-time high of 8027.18. Last Thursday’s intraday high of 7975.33 came within 0.65 percent of that record. This Thursday, it again pulled back after making a weekly high of 7950.21. Both those sessions were marked by candles with long shadows.
Flows into QQQ (Invesco QQQ Trust) in the week to Wednesday were positive – inflows of $523 million (courtesy of ETF.com), but at the same time subtle signs of distribution are showing up.
For now, 7700 is where a rising trend line from last December lies. Throughout August, bulls used that as support to buy weakness. At 7769.02 lies the 50-day, which also approximates horizontal support.
Russell 2000 mini-index: Currently net short 24.8k, down 25.4k.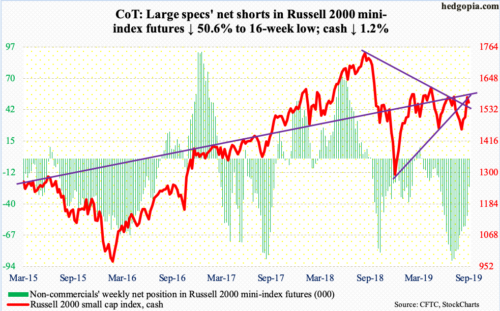
For the second week running, IWM (iShares Russell 2000 ETF) saw massive inflows, drawing $2.8 billion in the week to Wednesday. This followed inflows of $2.9 billion in the prior week. IJR (iShares Core S&P Small-Cap ETF) took in $48 million (courtesy of ETF.com).
Last week, at 1560, the cash (1559.76) broke out of a falling trend line from August last year when it peaked at 1742.09. Despite healthy flows, bulls had difficulty this week building on that. This week’s high of 1590.50 was posted on Monday. Going back to January last year, 1600, or just north of it, has been a source of major resistance.
The 50- and 200-day will be tested at 1528.91 and 1518.39 respectively.
US Dollar Index: Currently net long 41.8k, up 9.7k.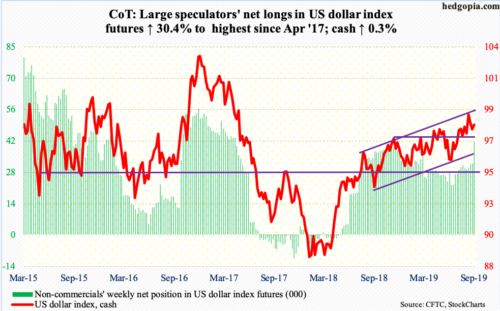
The 50-day at 97.78 approximates horizontal support at 97.50s. This was tested – successfully – for seven sessions, including Friday. The daily is oversold. On the 3rd this month, the cash (98.14) retreated after kissing the top of a one-year rising channel at 99.33.
VIX: Currently net short 125.7k, up 32.2k.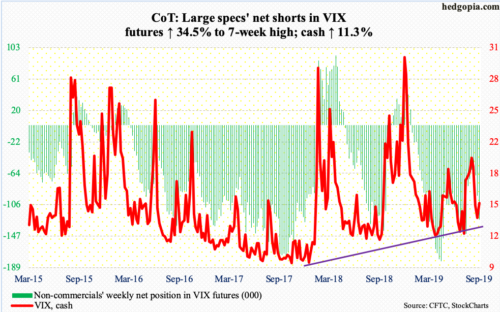
Thursday’s low of 13.31 was the lowest since July 30. The daily is oversold. The cash (15.32) is itching to rally.
Concurrently, the 21-day moving average of the CBOE equity-only put-to-call ratio ended the week at 0.644. Tuesday, it dropped to 0.636. Earlier on August 23, it peaked at 0.733. Normally, it tends to bottom at high-0.50s to low-0.60s. If the ratio has indeed bottomed, it tends to peak at high 0.60s to low 0.70s, which is what took place mid-August. A rise in the ratio tends to coincide with a drop in the S&P 500.


