
The Short-Term Trend May Have Room To Run Higher
The Short-Term Trend
The short-term uptrend continues, but the PMO has moved quickly from the bottom of its range to the top of its range. With the PMO at this level, the time for aggressive buying has passed.

If the time has passed for aggressive buying, then how long before we start to take partial profits, trim laggards, and raise a little cash?
The chart below includes the same PMO index as shown above, but with the SPX summation in the main panel. The summation is still rising sharply and coming off a low level, which shows that the short-term trend may still have some room to run higher despite the fact that the PMO is at the top of its range. This chart gives us a rough estimate of how long the uptrend may last so that we know when to prepare for the next downtrend.

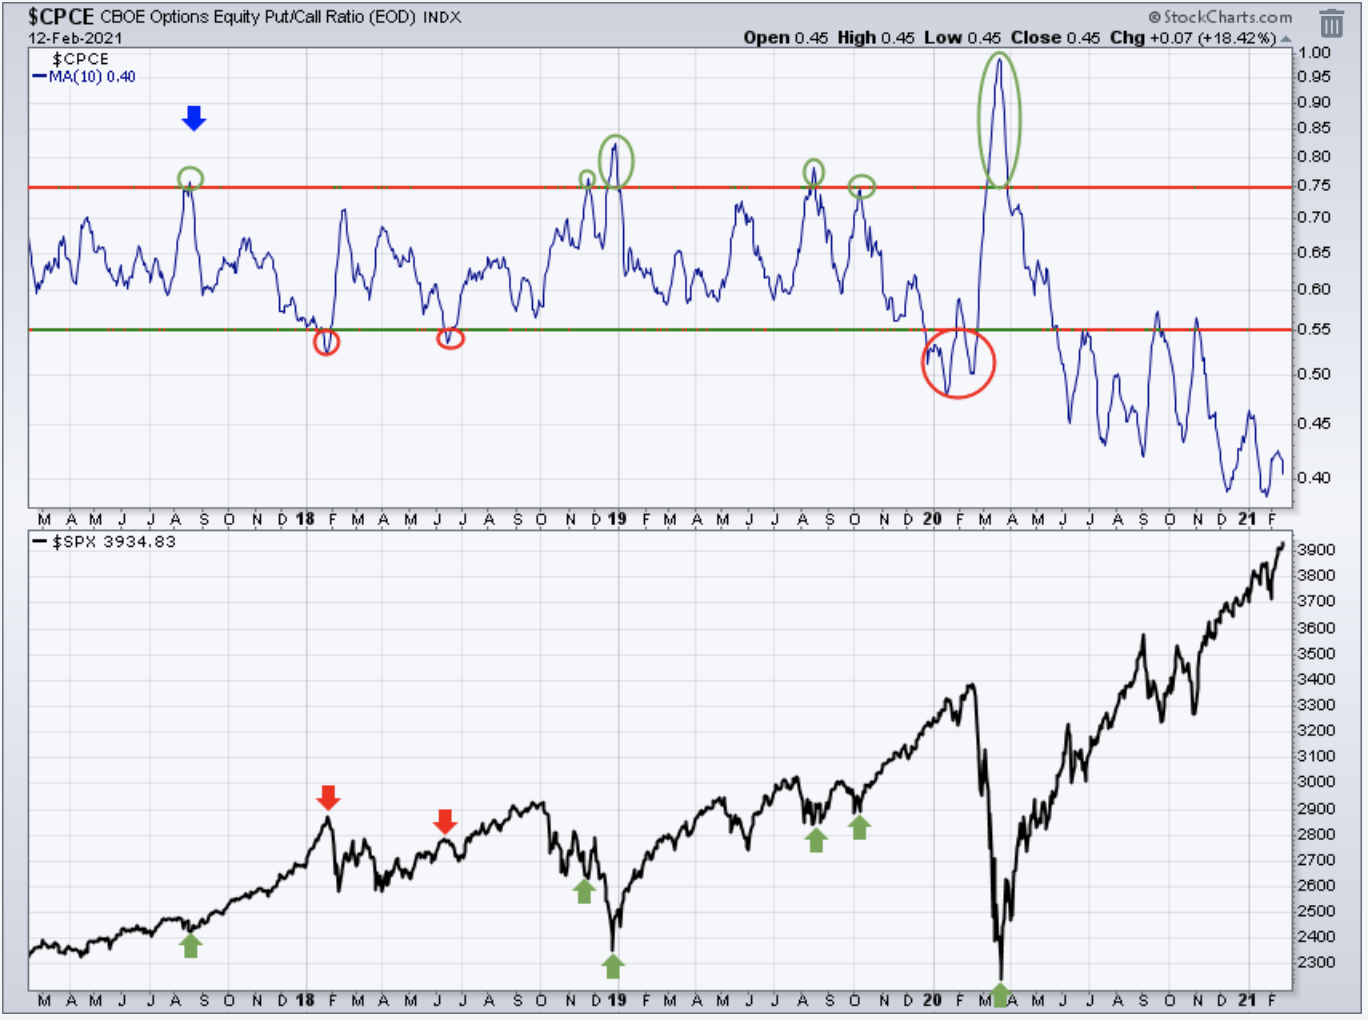
The call/put ratio moved higher on Friday, Feb. 12, and is now convincingly pointing higher. This strong move in the call/put is a bit late and out-of-sync with the PMO index. I'd rather see a move like this when the PMO is just moving off the bottom. I'm not really certain, but it seems like an indication of call-buyer capitulation and bullish market froth, although I don't think anyone needs any more evidence of that. This market is definitely frothy.

I started getting a little worried about the market early in the week when Investor's Business Daily (IBD) started voicing concerns about the extended nature of the indexes and the risk of a pullback. Their main concern is how far the NASDAQ is above its moving averages.
They feel that when the index is this extended there is usually a high risk of a pullback. As you can see from the chart below, the risk of the extended NASDAQ still exists, although the advance in the index seems orderly and tight, which is a good sign.

IBD also stated that they were nervous because they were seeing a number of blow-off-top chart patterns among the high-growth, small-cap stocks that they like to trade. I would definitely agree with this, although it seems to me as though for every blow-off top, there is another small-cap that is breaking out and starting to run higher. So, again, I'm not certain about the risks.

The market is clearly in a very bullish period, and caution flags regarding extended stock prices are waving. For me, I'm reminded of the books I've read about trading during spectacular bull markets in the past. These periods in the stock market are rare opportunities, and it is time to press the pedal to the floor to take advantage, but one must do so with a full understanding that it comes to an end at some point.
In other words, this is the opportunity that we train for by watching the markets closely for years, and it is time to show ourselves what we've learned to do.
The Longer-Term Outlook
The big news in the stock market this week was the semiconductor supply shortage mentioned by so many semiconductor-consuming companies that had to limit production until semiconductor supply balances with demand. This news has been circulating for a number of weeks, but it started to break early this past week.
However, it took until Thursday and Friday before the semiconductor stocks really started to rally. I think it took people a few days to sort out whether the shortage was good or bad for the semiconductor company profits in the short-term. After all, in order to ramp up supply, these companies will need to spend in order to expand capacity. I guess the consensus is that the shortage is good for these companies, and I would agree.

Here is a look at the monthly chart of the same index. It seems very extended, so it's no wonder people were hesitant to jump in. This is my favorite group, but my eyes are wide open with regard to the risks.

This chart shows the ECRI index which continues to push higher, and in the lower panel is the S&P-1500 which has rallied in a nice correlation with the ECRI index. When the ECRI finally ticks below its moving average, we will need to evaluate the implications of a potentially declining ECRI index from such a high level. My guess is that the market won't be quite so easy to trade when the ECRI starts to decline.

Many of us have been waiting and watching this index to see when, if ever, it starts to rise again. The PMO is getting closer to where you would think it would start to bottom out. Look for the GDX to close above the 10-week average.

This chart has been driving me wild for months. What to think? The only thing I can say is that I feel confident it will move back into the traditional range at some point. When that happens, the market will either move lower or move sideways to consolidate these gains.
Bottom line
I'm doing everything I can to take advantage of this bull market while keeping in mind that once the money is made, I have to also know how to hang on to it.
Outlook Summary
- The short-term trend is up for stock prices as of Feb. 1.
- Contrarian sentiment is unfavorable for stock prices as of Nov. 14.
- The economy is in expansion as of Sept. 19.
- The medium-term trend for treasury bonds is down as of Oct. 10 (prices lower, yields higher).
Disclaimer: I am not a registered investment adviser. My comments reflect my view of the market, and what I am doing with my accounts. The analysis is not a recommendation to buy, sell, ...
more

