
The Question Of The Day
The question of the day from a technical perspective is if the stock market is "breaking out" to the upside. If the answer is yes, then we need to assume that the next leg of the current bull market is about to get underway and all dips should be bought. Good times!
However, if we are in for yet another "breakout fake out" then traders need to play the game very differently. No, instead of a "buy high and sell higher" approach, it is usually better to "ride the range" when stocks are stuck in a sideways consolidation phase. In short, this means that traders may be looking to "sell the rips" while waiting for prices to test the lower end of the range.
But before we attempt to come up with an answer, let's take a look at the state of our trend and momentum indicators.
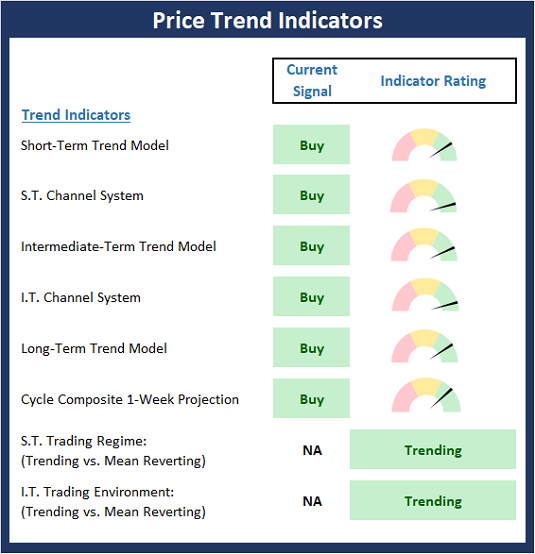
The State of the Trend Indicators
The Trend board indicators are designed to determine the overall technical health of the current stock market trend in terms of the short- and intermediate-term time frames.
The Trend board has scored a perfect 10.0 this week as every single box is green. There are two ways to look at such a reading. First, the bulls will opine that the current state of the trend board means the market is "in gear" and there is more upside to come. On the other hand, given the question of the day, the skeptic in me will note that universally favorable readings on the trend board often lead to pullbacks.
Gun to the head, I'll side with the bull camp here. Sure, stocks have all kinds of issues to deal with and a pullback could occur at any time, for any reason. However, as a long time "trend and momentum guy," I'm thinking the trend is my friend here.
* Source: Ned Davis Research (NDR) as of the date of publication. Historical returns are hypothetical average annual performances calculated by NDR. Past performances do not guarantee future results or profitability - NOT INDIVIDUAL INVESTMENT ADVICE.
My Take on the State of the Charts...
As I wrote last time, one of the most positive things a market can do is to break out of a range. And to be sure, the S&P 500 appears to be breaking higher. But... In order for a breakout to be valid it must (a) be confirmed by other indices and (b) avoid dipping back into the range.
So, as the chart below suggests, the S&P appears to be "working" on creating a breakout.
S&P 500 - Daily
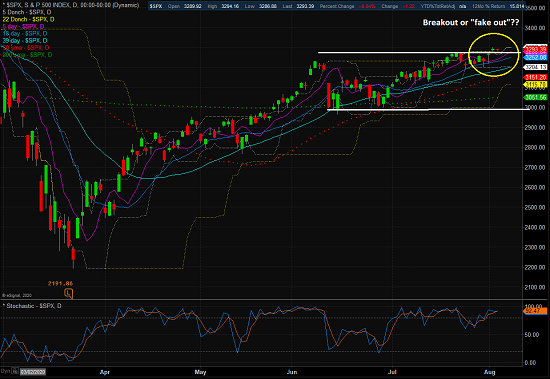
However, the fly in the ointment here is the "confirmation" part. As in, there isn't much to be found.
Looking through the charts of the major indices, I see that even the market darlings Nasdaq 100 remains stuck in a range and as such, hasn't confirmed the S&P's move.
Nasdaq 100 - Daily
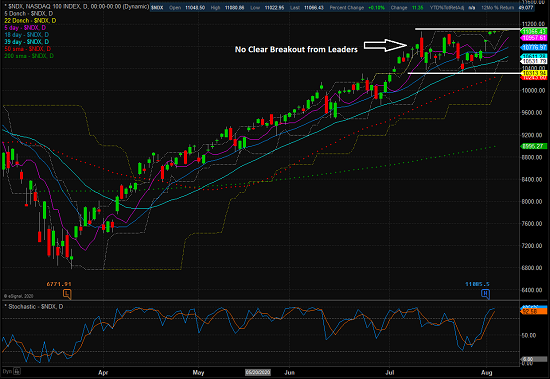
Looking at the rest of the indices, the same story holds. The DJIA is clearly going nowhere fast. The small-caps are moving sideways. Same for the midcaps.
Therefore, I won't argue with anyone who remains skeptical of the bull case here.
But there is some good news. Take a peek at the chart of the growth stocks (as illustrated by Vanguard's Growth Index fund - VUG) below.
Vanguard Growth (VUG) - Daily
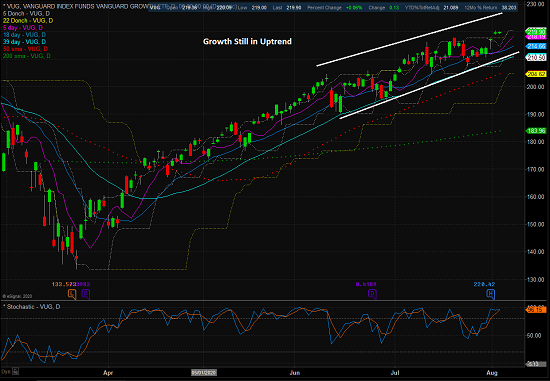
There can be little argument that growth stocks are in a confirmed uptrend and are not at all struggling with a sideways trading range.
So, from my seat, the answer to today's question depends on which "market" you are looking at. If you are focused on the COVID winners and the growth-oriented names, then the trend is up and there is nothing to do.
However, if you are focused on the other indices that are more economically sensitive, well, it's a different story. And until a medical solution to the virus begins to appear on the horizon or the U.S. successfully suppresses the spread of the darn thing, this story is unlikely to change.
The State of Market Momentum
Once we've reviewed the state of the trend board and the action on the charts, we then analyze the internals to determine if there is any "oomph" behind the current trend via our group of market momentum indicators/models.
The is one change to report on the Momentum Board as our short-term trend and breadth confirm model upticked to positive. However, this is a very sensitive set of indicators that has been flip-flopping between positive and negative on a regular basis for the past month or so. All in, I'll score the board as moderately positive, which is in keeping with the struggle currently playing out in the major indices. The bottom line is I'd like to see our intermediate-term breadth model turn green before getting too excited about another meaningful leg higher.
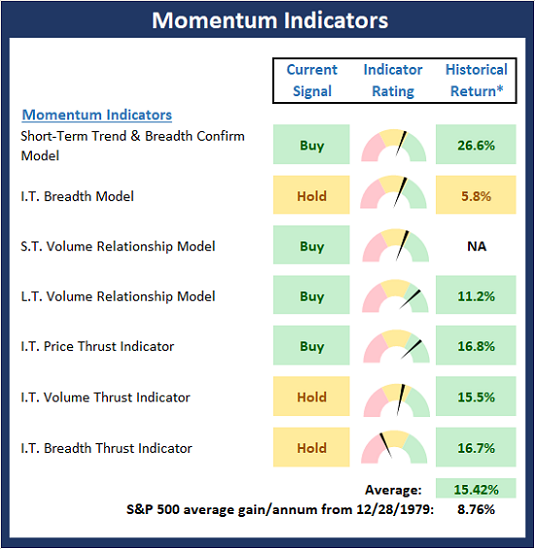
* Source: Ned Davis Research (NDR) as of the date of publication. Historical returns are hypothetical average annual performances calculated by NDR. Past performances do not guarantee future results or profitability - NOT INDIVIDUAL INVESTMENT ADVICE.
The Bottom Line
The trend is up and the market leaders continue to move from the lower left to the upper right on the charts. Momentum is "pretty good" but could be better. Therefore, my plan is to (a) continue to give the bulls the benefit of any doubt, (b) overweight the leaders/growth stocks, and (c) keep some powder dry in the event that the bears can muster a test of the lower depths of the range.
Disclosure: At the time of publication, Mr. Moenning held long positions in the following securities mentioned: none - Note that positions may change at any time.
The opinions and forecasts ...
more

