
The Market May Or May Not Crash But Even If It Does, You Don’t Have To Follow It Down
I just searched “stock market bubble” and Google returned “About 127,000,000 results.” Changing “bubble” to “crash” boosted the total to 268,000,000. Steve Sjuggerud opened his March 15, 2021 Stansberry Daily Wealth commentary by announcing that “The Melt Up will end sometime this year” (but not necessarily right now). Does this remind you of the 2000-02 tech wreck reflected in the 73% collapse of the tech-heavy Invesco QQQ Trust Series I ETF (QQQ) between 1/2/00 and 12/31/02 (with an interim “maximum drawdown” of 83%). If you’re worried, now is as good a time as any to remind you that you are a decision-making investor — not the market.

© Can Stock Photo / ginosphotos
Market Timing: Do We Dare?
This can be a tough topic. Many dream of trying to pick tops and bottoms. Many others warn it can’t be reliably done.
For most of the past 40 years, when falling interest rates and strong economic activity pushed stocks higher and higher, this wasn’t that critical a topic. Score one for buy-and-hold.
There were bear markets along the way. But looking back on them feels like watching an old WWII movie. We know it was awful at the time. But we can relax. We know the good guys won. Score two for buy-and-hold.
Now, following a massive multi-year melt-up for many stocks and ETFs, which accelerated in 2020, there’s now concern that a new crisis may be near. Even if it happens, investors twenty years from now will probably look back on it the way we look back at the 1987 crash, the 2000-02 crash or the 2008 crash. It was bad, they’ll say. But those who were patient were better off over the long term.
How about . . . No!
No matter how mundane a calamity may appear when dispassionately analyzed by future historians, those who are there at or before the start can and should think about how to survive. It’s not necessarily easy. Market timing really is hard. But it’s not all or nothing proposition. As challenging as market timing is, we don’t have to choose between doing it or closing our eyes and hoping for the best.
You Don’t Need To Be Psychic, Just Smart
You don’t have to try to predict each up or down market move. You just need two things.
One is a set of reasonable expectations. Understand that as humans who can’t see the future, we won’t catch the very tops or very bottoms unless we get lucky. Aim at holding losses to tolerable levels, rather than fantasizing that you can entirely eliminate them.
Second, develop a systematic way to look at the investments you hold (this is more important than watching market indexes). Focus on facts, not emotion, and react logically to new information as it comes in. And this is not the 17th century Dutch Tulip mania. It’s the information age; new information will keep coming to you.
By the way, being systematic (a good thing) is not the same as being rigid. It’s OK to enhance your “system” with common-sense.
Being Smart By Using Power Gauge
The Chaikin Power Gauge ratings and the way they are presented on Chaikin Analytics gives you the tools you need to stand safely on reasonably high ground (not necessarily the peak — let’s be realistic here, but on reasonably solid ground) and wave “bye bye” to former high fliers as they continue to careen lower and lower.
Power Gauge is a 20-factor model that incorporates all of the elements that make stocks behave as they do. Consistent with what many quant models examine, Power Gauge considers valuation and quality/business risk.
But the largest number of factors tap into the investment community’s expectations about the future (growth). The latter is often skipped by classic quants because it’s hard to measure. But it’s important. It’s why anyone would choose stocks over less-risky fixed income. (Click here to see all the Power Gauge stock factors.)
Power Gauge rates stocks and ETFs along a seven-part scale ranging from Very Bullish to Very Bearish. For the sake of convenience, I’ll refer to the ratings in terms of the way they are color coded on Chaikin Analytics; Green (Very Bullish or Bullish), Red (Very Bearish or Bearish) or Yellow (three varieties of Neutral).
ETF Power Ratings use the same green-yellow-red scale but are computed differently. For US Equity ETFs, 40% of the rating is derived from the Power Gauge ratings of the stocks in the portfolios. The remaining 60% comes from a Technical rank designed specifically for ETFs. ETFs that don’t hold US stocks are based entirely on the Technical scores.
Using Power Gauge To Monitor ETF Positions
Selling is a topic that has long perplexed investors. Obviously, the investment merits of the security matter. It also depends on individual time horizons and risk tolerances. Given the variety of factors that can influence a decision to sell, we do not typically advocate using a rank change from Green to Yellow as an automatic sell signal. But sometimes, we find ourselves in atypical situations.
You don’t usually have to be the first one to leave a party. But, when the festivities are running very late into the night, it’s OK to leave when the person who drove you there decides to call it a night and asks if you want a ride home. It may be unwise to stay longer. It be hard to get a late-hours Uber. And worse, the host may say “No, you can’t stay here and sleep on the couch.”
When it comes to ETFs and Power Gauge, consider Mr. Growth Expectations as the person who drove you to the party. He’s the reason why the factors that make Technical Rank what it is. And he plays a prominent role in the ranks of the stocks that are in ETF portfolios.
So when an ETF rank drops from Green to Yellow, react as if your driver is asking if you want a ride home.
If it’s an ordinary party and the night is still young, feel free, if you want, to decline the invitation and get home on your own.
But if your ETFs have melted up and if words like “bubble” and “crash” are becoming part of everyday conversation, you don’t have to be a hero. Don’t be the one who is still wearing the lampshade and dancing on the table, at 4 AM. If you made it to midnight, you did fine. Don’t be ashamed to leave while your designated driver is still sober.
Figures 1, 2 and 3 show how the ETF rankings can, indeed, get you out of the party before it gets broken up by the police. (And if it’s the Value Police that show up, you really want to be gone before they come in come in swinging!)
Figure 1 – ARKK
(Click on image to enlarge)
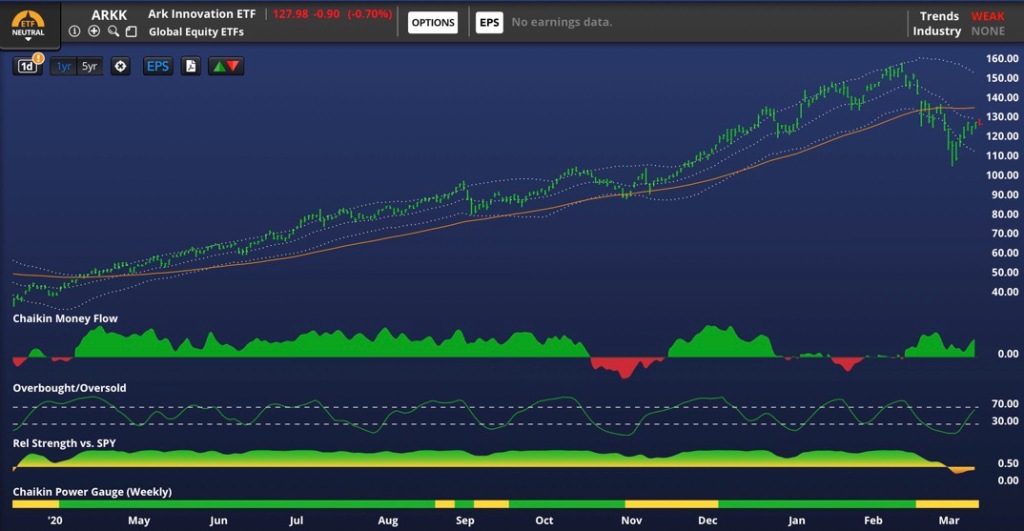
This is the flagship ARK Invest (Catherine Wood) ETF.
Figure 2 – OGIG
(Click on image to enlarge)

This is O’Shares, as in Kevin O’Leary a/k/a Shark Tank’s “Mr. Wonderful” and his foray into disruptive growth.
Figure 3 – XITK
(Click on image to enlarge)
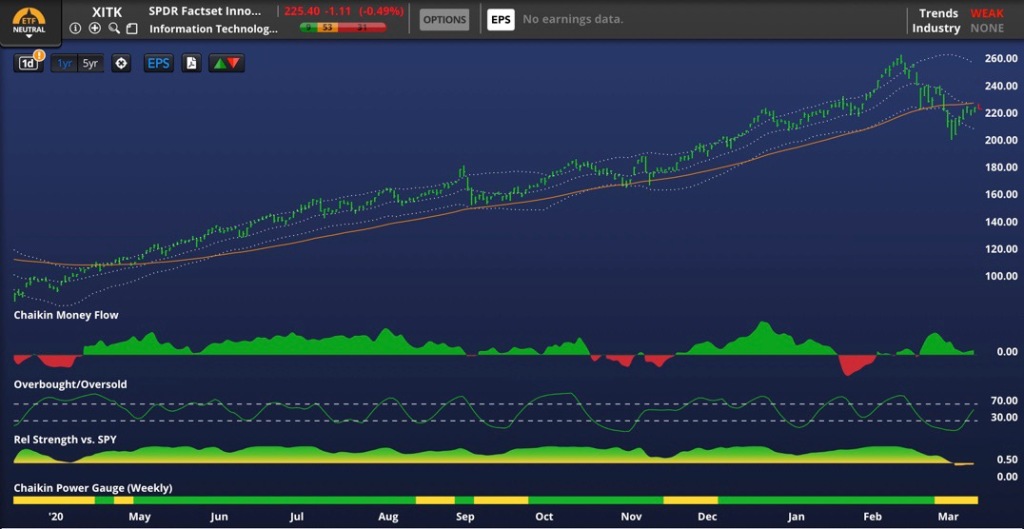
A less concentrated Innovative Tech ETF that holds more names (100) than ARKK (50 names) and OGIG (58 names) and aims at equal weighting.
Using Power Gauge To Monitor Stock Positions
With stocks, we can simply use the overall Power Gauge rank as suggested for ETFs. But there’s a difference. Stock ranks use a set of more detailed growth-proxy/sentiment type factors. They also consider valuation and business risk.
Using portfolio123.com, the platform on which Power Gauge was initially created, I examined the performance of all Green-ranked stocks in 2000-02. Table 1 shows the results. Comparisons are made against the following benchmarks:
- The Russell 3000 – an overall measure of the broad market
- The S&P 500 Equal Weight Index – a blue chip measure that eliminates the extra size bias that results from the market capitalization weighting of most indexes.
- The Russell Large-cap Value Index
- The Russell Large-cap Growth Index
- The NASDQ 100 Index, the popular superstar of the pre-crash period that held many of the stocks bubble-riders most favored and the ones which badly burned them during the crash
Table 1
(Click on image to enlarge)

So on the whole, we’re back where we were with ETFs. If you’re worried about a crash, just sell any stock whose Power Gauge rank falls from Green to Yellow.
Let’s Not Stop Here
Table 1, like other statistical tests, looks at the overall performance of large groups of stocks. But not all stocks within such big groups perform well. Any statistical “bucket” will include lots of gems and plenty of dogs, and that’s fine as long as there aren’t too many dogs.
How can you know your stock isn’t one of the dogs?
There is no foolproof answer. We can’t escape probability. But we can do things that push us closer to the ultimate goal; the specific.
None of the following test results will match Table 1. So be it. I’m not trying to impress you by crafting a great backtest. I want to suggest other possibilities that may be closer to real-life experience.
Drilling Down By Working With Factor Ranks
I’m going to focus here on concerns that most likely worry those who fear a crash:
“What might happen to my beloved high-flying long-term disruptive growth companies? I don’t want to get destroyed. But I don’t want to cash out if I don’t really have to. It may just be a correction, not a crash. And I can be patient; as long as things don’t get completely crazy.”
Chaikin Analytics doesn’t just publish overall Power Gauge stock ranks. It also publishes factor ranks for each of the 20 items upon which it’s based.
Our hypothetical super-growth investor is most likely looking at stocks that are described by many investors as overvalued — or extremely overvalued. Hence the four valuation ratios within Power Gauge probably have Red (Very Bearish or Bearish) factor ranks. That the overall rank is Yellow or Green is probably due to strength in other categories.
So let’s see what could happen if investors hold such stocks through a crash. Can strength in non-valuation factors justify a decision to continue holding the high fliers?
Table 2 shows the 2000-02 performance of stocks that rate Red under all four value-based factors.
Table 2
(Click on image to enlarge)

That’s awful.
Tables 3 and 4 show the performance of stocks with Red Value sub-factor scores and Red scores for overall Power Gauge.
Table 3
(Click on image to enlarge)
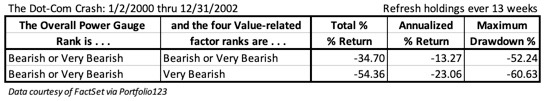
Table 4
(Click on image to enlarge)

That’s worse than awful.
Let’s now turn things around. Table 5 shows the 2000-02 performance of stocks with Red valuation factor scores but now, the overall rank is Green or Yellow. We’re now tolerating stocks widely accused of being overvalued if they make up for it with strength in other factors.
Table 5
(Click on image to enlarge)

How about that!
High valuation matched with strength in other respects is a lot better than high valuation alone. This is no surprise. Financial theory makes it clear that there is nothing wrong with high P/E, etc. per se. A ratio is too high only if it is not justified by favorable (and credible) growth expectations and/or favorable views of business risk/quality. Click here for more on this.
Tables 6 through 9 add market context. Each of the bad-value//good-overall-score strategies is shown in relation to pertinent market benchmarks.
Table 6
(Click on image to enlarge)

Table 7
(Click on image to enlarge)

Table 8
(Click on image to enlarge)

Table 9
(Click on image to enlarge)

Nothing in Tables 6-9 is as favorable as Table 1, where we simply refused to hold any stock that didn’t have a Green Power Gauge rank. But by drilling down, we addressed two problems.
- We provided a framework through which investors who really cherish their high fliers can decide which of these they might be able to hold, and which really need to be sold, like it or not.
- We provide a framework investors can use to narrow down from the large numbers of stocks that make it into the statistical bucket addressed in Table 1.
The Bottom Line
If you are completely sure the market is about to crash, sell everything — obviously.
But who in the real world is ever sure of that? (I’m talking about before-the-fact, not folks who surface several years later and brag about how they anticipated bad times and didn’t lose a cent.)
Real-world investors facing real uncertainties don’t have to choose between holding or selling everything. That’s even so if you love high-flying super-growth names. You can limit crash risk by using objective information (such as that provided in Power Gauge and its 20 factors) to tell you stock-by-stock when the risk-reward ratio has turned against you.
Sticking with Green-ranked stocks and ETFs is the first-choice strategy, whether you seek high-fliers or less dramatic names. (If you want to go further in the area of risk control, such as limiting sectors you’ll consider or working with Beta, you can do that too. This is a topic for another day.)
What you don’t want to do is hold stocks with Red valuation scores and Yellow (or, heaven forbid, red) overall ranks. Don’t fret even if you love the company. Keep monitoring Power Gauge to watch for an opportunity to get back in (i.e., when the overall rank goes back to Green). You probably have a zero-commission broker so that’s not an obstacle to going out and back in. Generating taxable events is never fun but crash-sized losses can hurt a lot more.
There’s no guaranty a future crash will play out the same way as 2000-02. But the study results here are consistent with what financial theory tells us to expect. That’s a plus. So, too, is the anecdotal evidence we’re accumulating now, as many of the highest high fliers, such as Tesla (TSLA), Zoom (ZM), Netflix (NFLX), Amazon (AMZN), DocuSign (DOCU), Twitter (TWTR), Facebook (FB), Apple (AAPL), Uber (UBER), Pinterest (PINS) and Microsoft (MSFT) already have Yellow or Red Power Gauge ranks.
Disclosure: Long ARKK, XITK, OGIG
Disclaimer: None.


Thanks for a good mix of information and insight and some education. And let me add my observation, which is that to make profit selling stocks you must have buyers for them. That observation comes from an engineering background. It is quite brutal but certainly true.