
The Long-Short US Sector Rotation Strategy
The following paper will explain how to build a U.S. sector rotation strategy (a US sector rotation meta strategy combining dynamically 5 different sector strategies based on SPDR ETF) which allocates dynamically between 4 different long US sector rotation strategies and one short US sector rotation strategy. This strategy is therefore different from our Global Sector Rotation strategy, as it only emplys US sectors.
Due to low correlation of these sector rotations, the combination creates an ETF sector rotation model with considerably higher Sharpe values. The addition of the negatively correlated short sector rotation model significantly reduces volatility and drawdowns during difficult market periods.
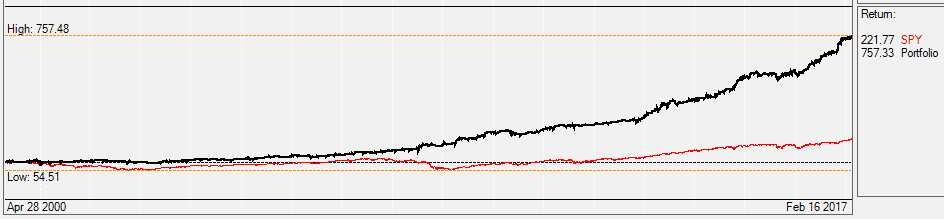
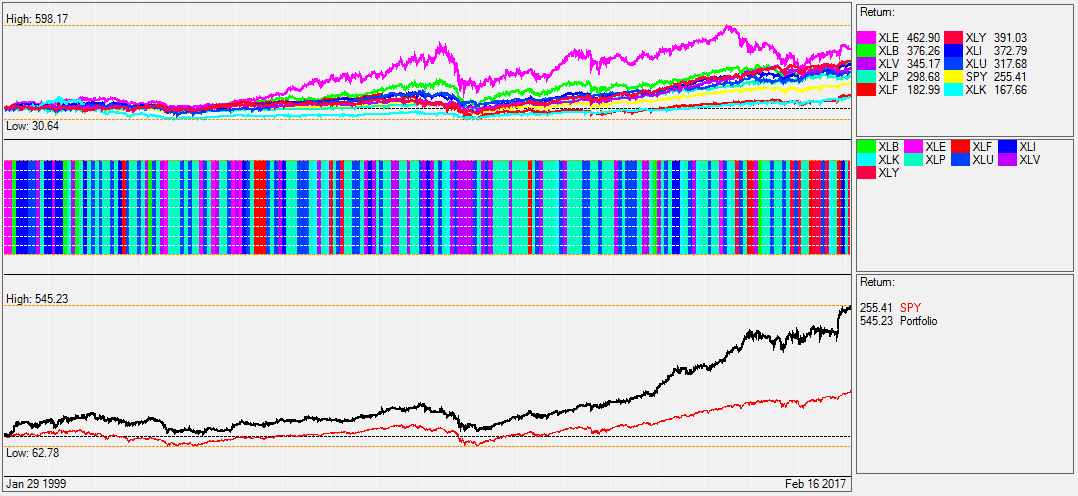
The chart shows the portfolio performance (black) compared with the S&P500 index (SPY ETF – red).
The result is a meta sector ETF rotation strategy which performed well since 2000 in the backtests. The Sector rotation strategy produced an average yearly profit of 12.8% (SPY 5.1%) and a Sharpe ratio of 1.16 (SPY 0.25). Maximum drawdown was only 17% (SPY ETF 55%). So, the sector rotation model performed about 4x better than the S&P500.
What makes this sector etf rotation strategy interesting is that it does not rely on either treasuries or bonds to balance out and hedge in times of market stress. It uses the short US ETF sector strategy as a hedge instead. The hedging mechanism is purely “short equity” and unrelated to whether interest rates rise, a common concern when holding bonds in a portfolio.
The U.S. Sector ETF’s – here SPDR ETF
U.S. sector ETFs, based on the Dow Jones U.S. Industry Indices, have been within the first ETFs on the U.S. market. There are sector ETF available from SPDR, Vanguard, Schwab, iShares. There are also European versions of these sector ETFs as well. These 10 Dow Jones U.S. Industry sectors cover about 95% of the US market. Their respective ETFs are highly liquid with small spreads which makes them excellent instruments to build dynamically rebalanced portfolio investment strategies.
For our ETF sector rotation model, we use the Select Sector SPDR ETF, but you can replace these sectors without any problem with the corresponding ETFs or Futures of other issuers. Using our QuantTrader backtesting software you can therefore modify this strategy to fit the ETF provided by your 401k or IRA Roth plan sponsor, use our QuantTrader free trial to simulate yours.
Here are the 10 main U.S. industry sectors currently available with sector SPDR ETF and the corresponding inverse (short) sector ETF with leverage.
| SECTOR | SECTOR SPDR ETF | INVERSE SECTOR SPDR ETF (LEVERAGE) | SECTOR FUTURES (GLOBEX) |
|---|---|---|---|
| U.S. Materials Sector | XLB ETF | SMN ETF(-2x) | IXB Future |
| U.S. Energy Sector | XLE ETF | ERY ETF(-3x) | IXE Future |
| U.S. Financial Sector | XLF ETF | SKF ETF(-2x) | IXM Future |
| U.S. Industrials Sector | XLI ETF | SIJ ETF(-2x) | IXI Future |
| U.S. Technology Sector | XLK ETF | REW ETF(-2x) | IXT Future |
| U.S. Consumer Staples Sector | XLP ETF | SZK ETF(-2x) | IXR Future |
| U.S. Real Estate Sector | XLRE ETF | SRS ETF(-2x) | |
| U.S. Utilities Sector | XLU ETF | SDP ETF(-2x) | IXU Future |
| U.S. Health Care Sector | XLV ETF | RXD ETF(-2x) | IXV Future |
| U.S. Consumer Discret. Sector | XLY ETF | SCC ETF(-2x) | IXY Future |
Extended backtest using SPDR ETF since 1999
The Select Sector SPDR ETF exist since 1999. Only the XLRE ETF for the real estate sector was added later in 2015. With the 9 main sector SPDR ETF in existence for nearly 18 years, we can easily perform long-term strategy backtests covering all sorts of economic events, including some important market corrections in 2000, 2008 and 2011.
Due to the small spread of these SPDR ETFs and low fees with good discount brokers we can rebalance our investment monthly at low cost.
For all 10 sectors, we also have inverse SPDR sector ETF. This allows us to short the worst performing sectors. If you use the inverse ETFs, then you have to take into account the leverage of these ETFs and divide your buy orders by 2x or 3x. If you invest using the sector futures, then shorting is no problem at all, however due to the size of the futures which is always around 100’000$ each, you should invest at least 500’000$ in such a strategy to be able to more or less achieve the requested allocations.
Most of our Logical Invest strategies are trend following strategies. This means that we follow longer economic cycles and try to outperform the S&P 500 index by rotating always on a selection of the best performing sector ETFs while avoiding the underperforming sectors.
US sectors are a very good way to do trend following, because each sector normally over- or under-performs for long periods at a time. This also means that over- or under-performance is due to longer lasting economic cycles, not just short term market fluctuations.
Economic cycle – base for our ETF sector rotation model
The economy itself is not a linear stable system, but swings between periods of expansion (growth) and contraction (recession). This results in a series of “market cycles” which are visualized in the following picture.
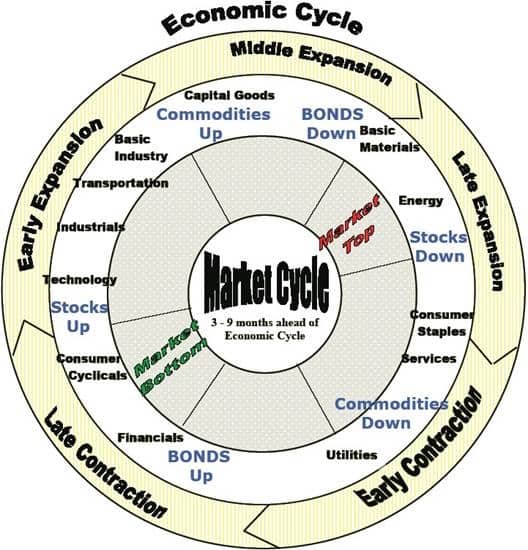
Source: http://www.nowandfutures.com (Global Business Cycles)
Each market cycle favors a different industry sector, and the goal of a good working sector rotation strategy is to invest always in the best performing sectors while avoiding or even shorting the worst performing sectors.
An overview of different U.S. sector rotation strategies
In fact there is not only one single trend following strategy possible, but we have different ways to construct sector rotation strategies. To backtest these sector rotation model we use our QuantTrader backtesting software.
Sub-strategy 1: A U.S. sector rotation Momentum Strategy with a long lookback period
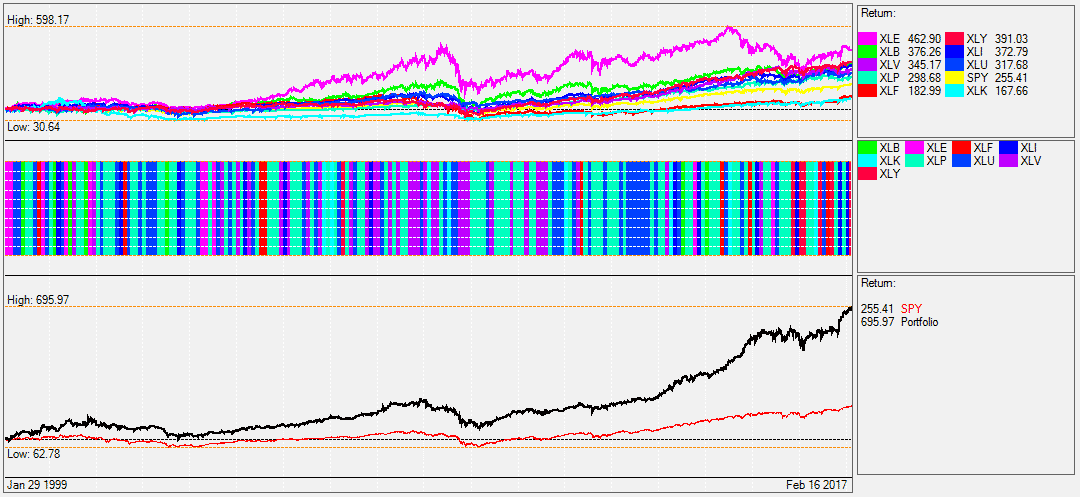
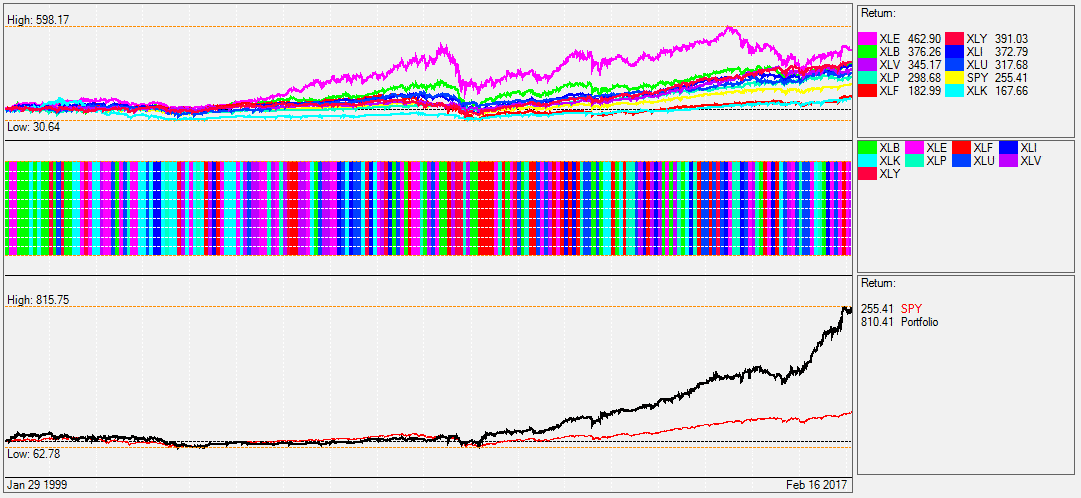
This is probably the most basic trend following strategy. The strategy ranks the Select Sector SPDR ETF and every month we invest in the top SPDR ETF for the following month. The image below shows the sector rotation model backtest using QuantTrader (QT). The backtest starts Oct. 29, 1999 until today. QT shows 3 panes. The top pane just shows the different SPDR sector ETFs performances. We did not include the relatively new XLRE ETF sector, but only the 9 basic industry sectors which allows for a longer backtest.
The middle pane shows the monthly changed asset allocation. In fact you see that we only used 6 of the 9 sectors, while more than half of the time the sector rotation strategy was invested in the consumer staples sector (XLP ETF) and also quite often in the utilities sector (XLU ETF ).
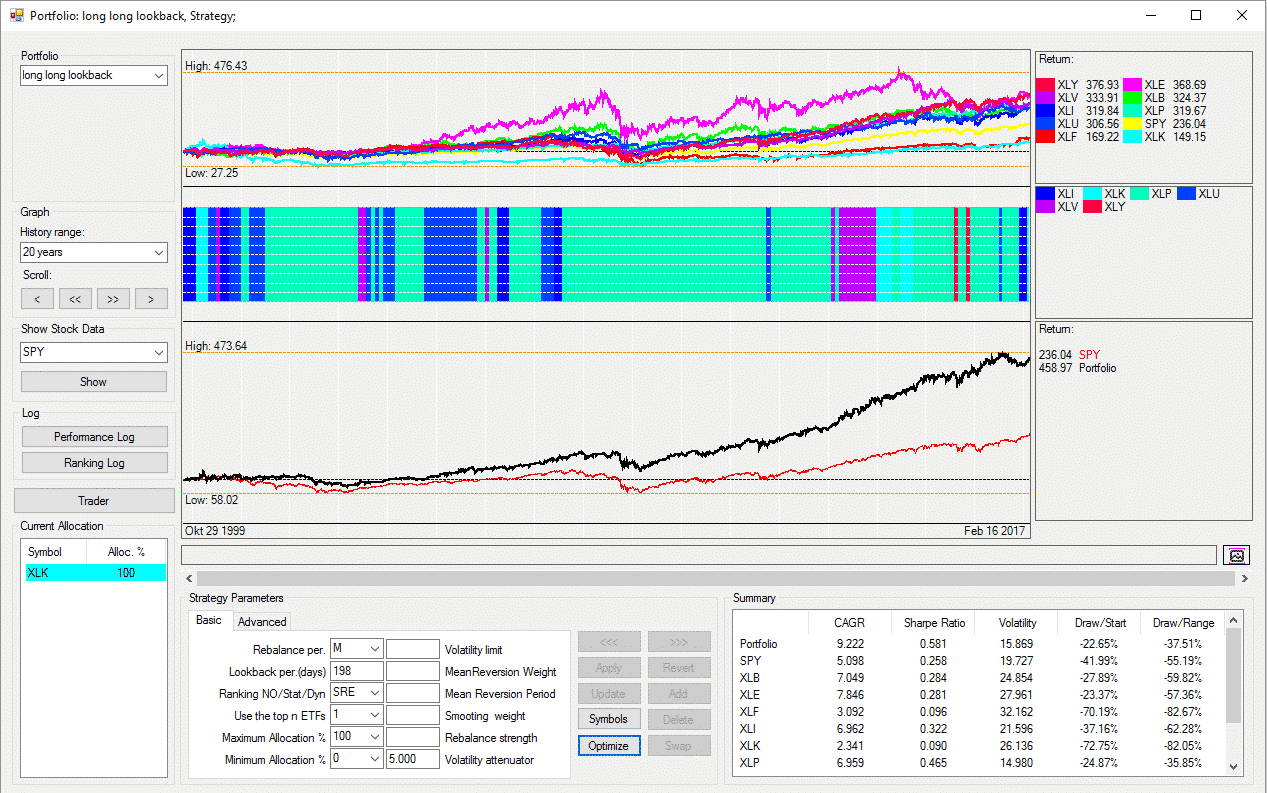
The last pane shows the portfolio performance (black) compared with the S&P500 index (SPY ETF – red).
The summary field shows that the sector rotation ETF strategy produced an average yearly profit of 9.22% (SPY ETF 5.1%) and a Sharpe ratio of 0.58 (SPY ETF 0.25). Maximum drawdown was 37% (SPY ETF 55%). So, the strategy performed about twice as good as a S&P500 index investment using the SPY ETF.
The ETF sector rotation model uses a lookback period of 198 days, and a volatility attenuator of 5. These 2 parameters are used to rank the SPDR sector ETFs each month and determine the top sector. The formula used to rank the ETFs is our modified Sharpe ratio which we have first introduced in the Universal Investment Strategy:
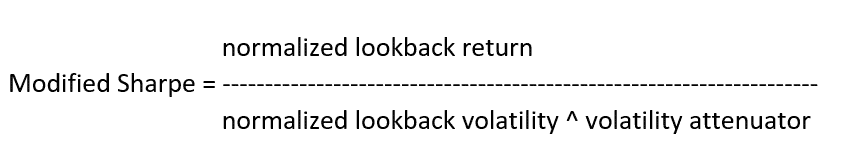
We normalize the returns because we want to rank also the SPDR sectors ETFs with negative return. The normal Sharpe calculation (Return/Volatility) can only be used for ETFs with positive return. Normalizing means that we use 1.05 for a +5% performance or 0.97 for a -3% performance. The volatility is normalized the same way.
Volatility attenuator – Modifying the Sharpe Ratio of the sector rotation ETF model
The volatility attenuator allows us to give a weight to the volatility or risk of an ETF. If the volatility attenuator is 1, then we have a normal Sharpe formula with performance divided by volatility. If the attenuator is 0, then we always divide by 1, which means that we rank only by performance and we do not consider volatility or risk. A volatility attenuator higher than 1 means that we rather want low volatility SPDR sector ETFs, but still prefer a good return.
For the strategy, we use a volatility attenuator of 5, which means that we want to select the SPDR sector ETFs with low volatility. The result is a volatility of 15 for this strategy which is lower than the volatility of most SPDR sectors ETFs or the SPY ETF. The lower drawdown of 37% compared to the other sector rotation models is also due to the lower volatility which tends to select safe haven sectors like Consumer Staples (XLP ETF) during market corrections.
Using these settings, this ETF sector rotation model is quite conservative and safe. For some bull market cycles, it is probably a little too safe, therefore we construct a second trend following strategy which is selecting well performing sectors a little bit more aggressively.
Sub-strategy 2: A U.S. momentum based sector rotation Strategy with a short lookback period
This sector rotation model has a lookback period of only 7 trading days. This means that each month it will invest in the best performing SPDR sector ETFs of the last 1.5 trading weeks.
Such a stock sector rotation strategy will automatically result in more frequent rebalancing. You see in the middle pane of the chart above, every single one of the 9 SPDR ETFs was used. This strategy however reacts much faster on market changes than the previous one, and about half of the time the strategy is invested in different sector ETFs than the strategy with a long lookback period.
The sector rotation model has a yearly profit of 9.86% (SPY ETF 5.1%) and a Sharpe ratio of 0.57 (SPY ETF 0.25). Maximum drawdown was 46% (SPY ETF 55%). So, the strategy performed about twice as good as a S&P500 index investment using the SPY ETF.
Combining both into one sector rotation strategy
The performance of the two stock sector rotation strategies using long and short lookback periods is nearly identical even if they invest half of the time in different sectors.
With our QuantTrader backtesting software, strategies themselves, can be used like ETFs in new strategies. We call such strategies meta-strategies (or strategy of strategies). Now, if you combine the previous two sector rotation strategies in a single sector rotation model you get a higher Sharpe ratio than the two single strategies.
If I dynamically allocate between the two strategies, then I get an average annual return of 10.5% with a Sharpe ratio of 0.66. During flat to declining markets, in the below charts you can see that the QuantTrader backtest will allocate most of the investment into the long lookback low volatility strategy. During bull markets the short lookback strategy seems to work better.
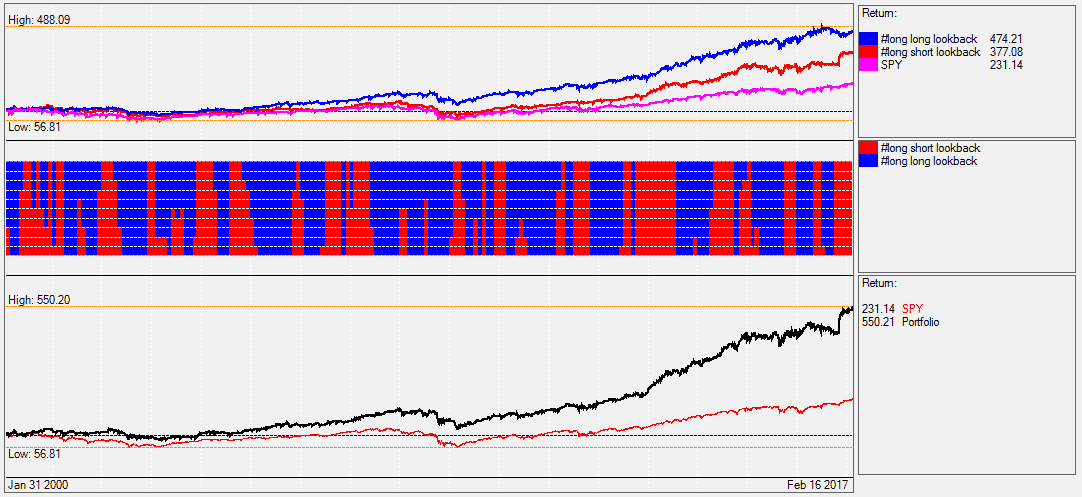
So, all together you can say that these two SPDR ETF rotation strategies complement each other quite well and it makes sense to use them together rather than only using one single strategy.
Mean reversion sector ETF rotation strategy
Another way to construct sector rotation strategies is to use mean reversion. In finance, mean reversion is the assumption that a stock’s price will tend to move to its own average, over time. When the current market price is less than the average price, the stock is considered attractive for purchase, with the expectation that the price will rise. When the current market price is above the average price, the market price is expected to fall. In other words, deviations from the average price are expected to revert to the mean.
Quant trader can be used to build such strategies with sector ETFs. The idea is that all sectors when averaged, will move in tandem with the market which is represented by the S&P 500. There are however each month sectors which perform much better or much worse than the average.
Normally the market exaggerates to the down- and to the upside moves of the best and the worst sector. There is a good probability that the worst sector will recover slightly from its losses the next month and the best ETF will give away some of its gain due to profit taking. Based on this probability we can now build some mean reversion strategies.
Sub-strategy 3: A U.S. sector rotation “buy the worst” mean reversion Strategy
The “buy the worst” mean reversion strategy works quite well, but it is not something for buy and hold investors. Nearly every month you have to invest in another of the SPDR sector ETFs as you can see in the charts below.
The sector rotation model calculates performance differently than for normal momentum strategies. For this strategy the perforance is calculated like this:
Performance = 10 day lookback performance – 2x 20 day lookback performance
The -2x 20 day performance means that the last month performance of the worst SPDR ETF is multiplied by -2x. If the worst SPDR ETF had a -3% performance, this will result in a positive +6% performance. To this we add the performance of the last 10 days.
The result is that an ETF with a positive convexity is preferred. In the chart below you have the performance curve of two SPDR sector ETFs. The green one goes down linearly but the red one oes down and during the last 10 days shows signs of recovery.
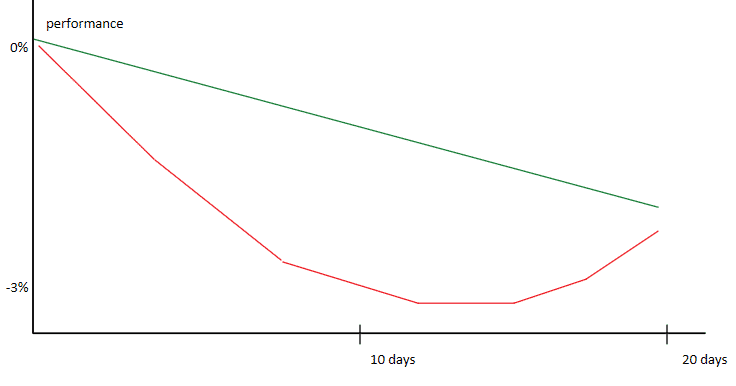
Our formula would select the red chart or sector ETF.
The strategy has a yearly profit of 11.36% (SPY ETF 5.1%) and a Sharpe ratio of 0.64 (SPY ETF 0.25). Maximum drawdown was 47% (SPY ETF 55%). So, the strategy also performed even slightly better than the two momentum strategies.
Mean reversion can also be combined with momentum. The next strategy will do exactly that:
Sub-strategy 4: U.S. sector rotation strategy using momentum and mean reversion
This strategy invests in the best momentum SPDR sector ETF which had a small correction during the last 2 weeks. During bull markets, many investors feel they just missed the opportunity to invest in a good performing sector. Since they do not like to buy at all time heights, they wait until there is a small correction of their favorite industry sector. Then they buy. This is what this strategy does, and it works quite well.
The stock sector rotation strategy has a yearly profit of 12.3% (SPY ETF 5.1%) and a Sharpe ratio of 0.47 (SPY ETF 0.25). Maximum drawdown was 47% (SPY ETF 55%). So, the model performed even slightly better than the two momentum models.
Sub-strategy 5: Short U.S. sector rotation “sell the best” mean reversion model
A very interesting strategy is a “sell the best” mean reversion Strategy. This is in fact a short strategy with a negative correlation to the market. Constructing profitable short strategies is very difficult. You have the market with a historical average performance of +5.1% working against you. I tried to use momentum and short always the worst ETF, but this does not work well because of the mean reversion which I used in the last strategy. The best way to short the market is to sell the best performing sector ETF, betting on the fact that it will probably revert to the mean on profit taking.
In the chart below you see the result of the “sell the best” shorting sector rotation ETF strategy.
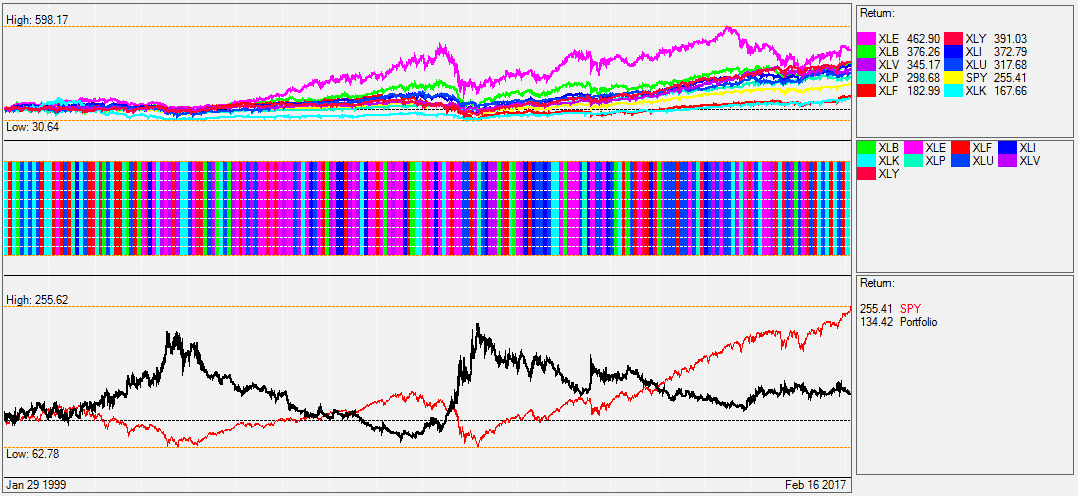
The sector rotation model has a yearly profit of 1.65% (SPY ETF 5.1%) and a Sharpe ratio of 0.07 (SPY ETF 0.25%). Maximum drawdown was 65% (SPY ETF 55%).
As you can see, the result is quite poor and it would not make sense to invest in such a strategy alone. What makes this strategy very good is that it has a nearly 100% negative correlation to all the long strategies and even with its poor performance you see that the strategy still has long periods where it worked really well. If markets begin to move sideways, the sector rotation model already goes up and this accelerates on down going markets. In fact it is a perfect hedging strategy.
Building a U.S. Sector Rotation meta-strategy using SPDR ETF
A meta-strategy is a strategy composed not of ETFs but of sub-strategies. QuantTrader calculates the performance of a strategy like an ETF. This way you can build a new U.S. sector rotation meta-strategy which is composed by our 5 previously discussed strategies.
We use a lookback period of 116 days and rank our 5 strategies. We limit the maximum allocation for each model to 40% and we calculate each month which asset allocation would have given the best Sharpe Ratio. Adding the short model will most likely increase the Sharpe Ratio more than the other models, because of its nearly 100% negative correlation. This negative correlation will reduce a lot the volatility of the composed meta-strategy.
The chart below shows the result produced by our backtesting software. The middle pane shows you how the asset allocation between the 5 different US Sector rotation strategies changed.
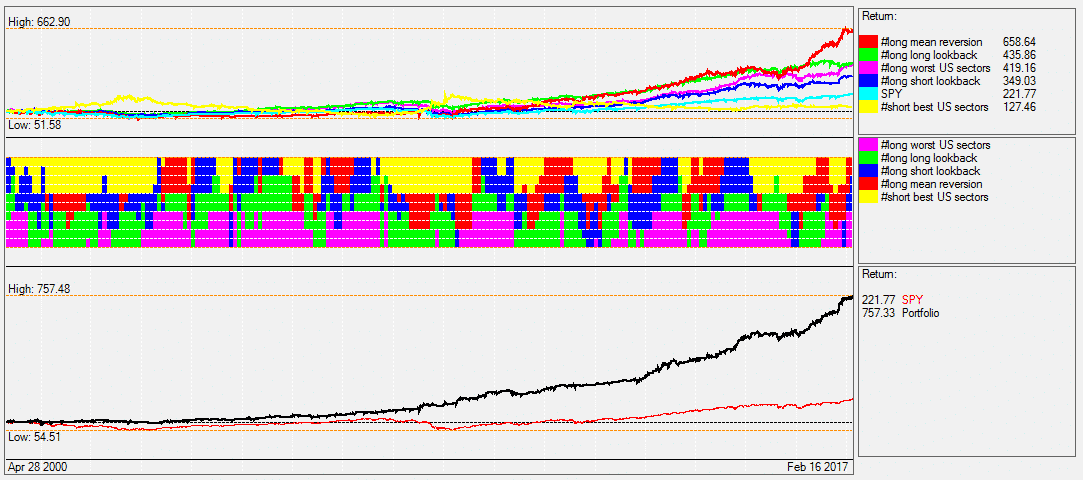
The strategy produced an average yearly profit of 12.8% (SPY ETF 5.1%) and a Sharpe Ratio of 1.16 (SPY ETF 0.25). Maximum drawdown was only 17% (SPY ETF 55%).
Backtest performance overview year 2000- 2017:
| SECTOR ROTATION STRATEGY | CAGR (COMPOUNDED AVERAGE GROWTH RATE) |
SHARPE (RETURN/RISK) | MAX DRAWDOWN |
|---|---|---|---|
| S&P 500 benchmark (SPY – ETF) | 5.10% | 0.25 | 55% |
| 1) Momentum long lookback | 9.22% | 0.58 | 37% |
| 2) Momentum short lookback | 9.86% | 0.57 | 46% |
| 3) Mean reversion “buy worst” | 11.36% | 0.64 | 47% |
| 4) Momentum and mean reversion | 12.30% | 0.47 | 47% |
| 5) Mean reversion “sell best” short strategy | 1.65% | 0.07 | 65% |
| 6) Meta-strategy including strategies 1-5 | 12.8% | 1.16 | 17% |
These backtest results of our sector rotation strategies emplying SPDR ETF are very promising. The backtests included many big market corrections and the sectors cover the whole U.S. market, so there is a low selection bias. The sector rotation models are also quite stable and work with a wide range of parameters with a lot of ETF changes over this long backtest period, so that there is not much danger of overfitting. I use this stock sector rotation strategy myself since quite some time and I think that the probability is high that this model continues to work also well in the future.
Free sector rotation strategy for all our followers
We´re offering this sector rotation strategy permanently for free to all interested followers, no subscription is needed. You can simply register for it from this link and will receive the monthly allocations by email.
Using our QuantTrader backtesting software you can modify this strategy to either fit the ETF provided by your 401k or IRA Roth plan sponsor, or to contribute to the vivid discussion in our QuantTrader forum to further enhance the strategy. Use our QuantTrader 30 days free trial to simulate yours.


