The ETF Portfolio Strategist - Saturday, May 15
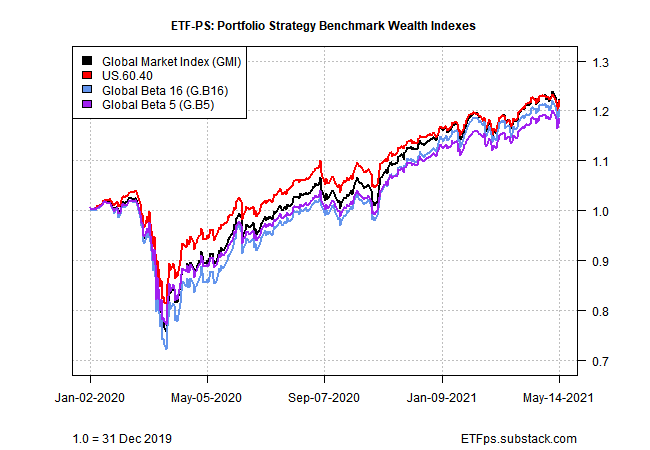
This past week saw across-the-board losses for global markets and portfolio strategy benchmarks taking a big hit.
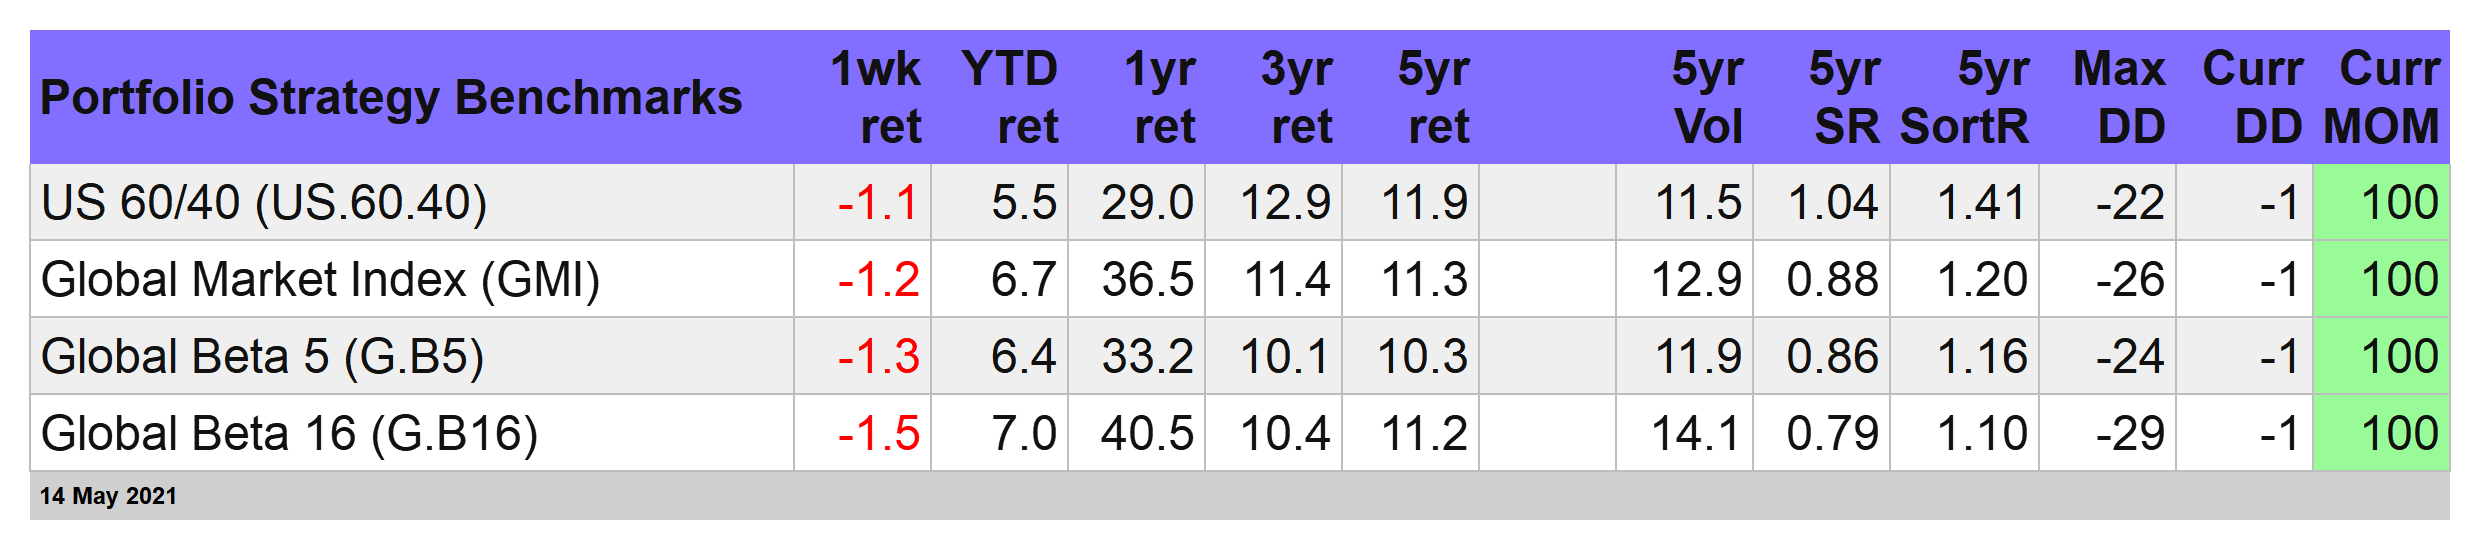
Red Ink, Near and Far
Another week, another run of big misses for US economic data. Last week it was payrolls. This time it’s a trifecta of numbers: inflation, retail spending, and industrial production.
The consumer price index (CPI) was much hotter than expected, while retail spending and industrial output came in substantially below their respective consensus forecasts. The noise factor for US macro is sky high as of late. The perception roller coaster took markets along for the ride.
The key takeaway for this week’s update on markets: nothing was spared for our 16-fund global opportunity set. Losses ranged from relatively light (Latin/South America shares) to a steep haircut for Asia ex-Japan stocks.
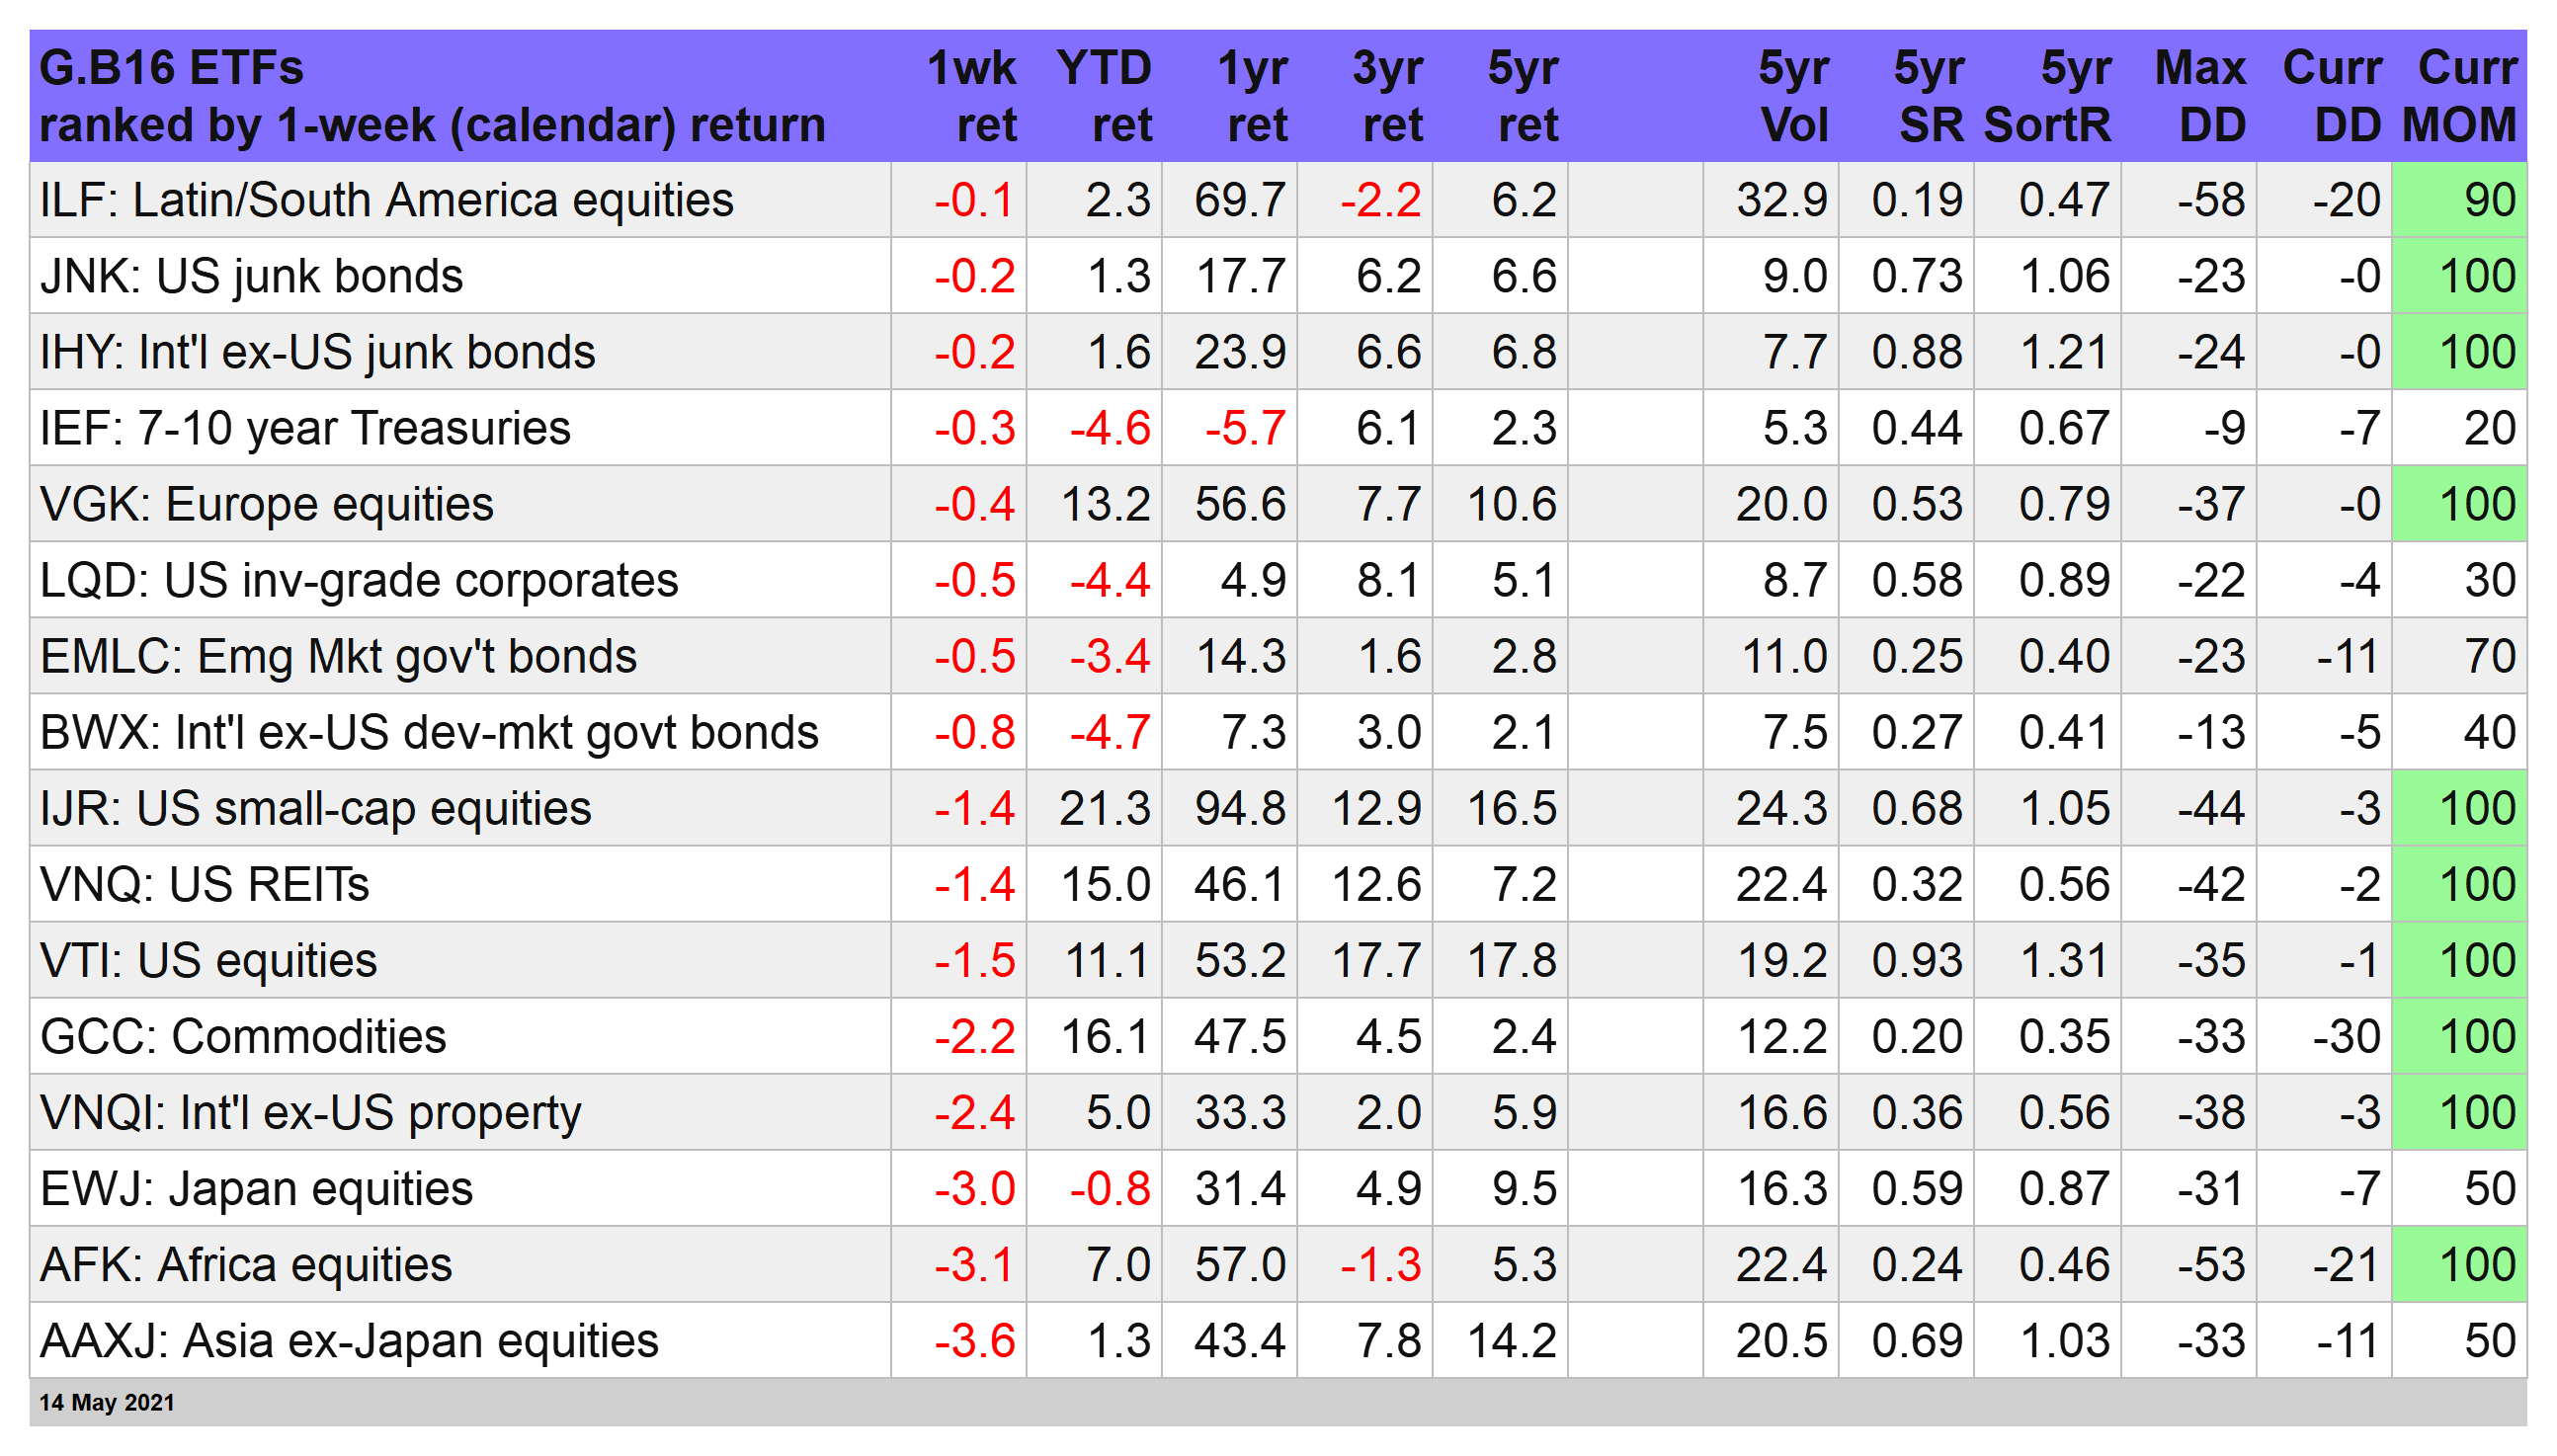
US stocks were part of the attitude adjustment. Vanguard Total US Stock Market (VTI) dropped 1.5%. That’s a middling setback for the trading week through May 14 in the table above, but as the weekly chart below suggests, the upside trend is having a hard time breaking through recent highs.
US shares may need to new catalyst to keep the party going. But after trillions in stimulus, signs that the worst of the pandemic in America is approaching a close, and a blowout gain in GDP for the first quarter, those former buy triggers will be tough acts to follow.

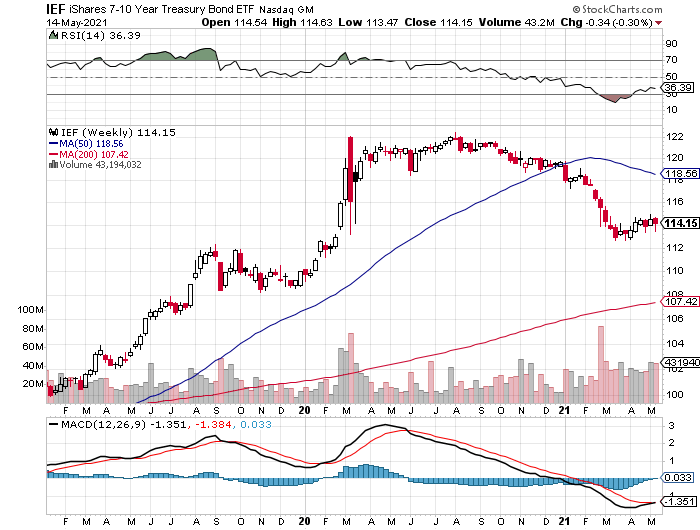
Meanwhile, US Treasuries continue to show an affinity for going nowhere fast. That’s in keeping with the benchmark 10-year Treasury yield’s ongoing flat-lining exhibition; the benchmark rate was up fractionally this week to 1.63%, but it continues to hold in a tight range as the crowd ponders whether to see the inflation threat as something more than a transitory affair.
Despite a furious debate on this front, iShares 7-10 Year Treasury Bond (IEF) only ticked gently lower this week.
The biggest setback: stocks in Asia outside of Japan. iShares MCI All Country Asia ex-Japan (AAXJ) tumbled 3.6%, cutting the fund to its lowest close this year. Our momentum ranking for AAXJ has been looking increasingly shaky lately and the latest decline doesn’t help. As the table above shows, AAXJ’s MOM score is now 50, the midway point between extreme bullish and bearish trending behavior.

No Shelter in Asset Allocation this Week
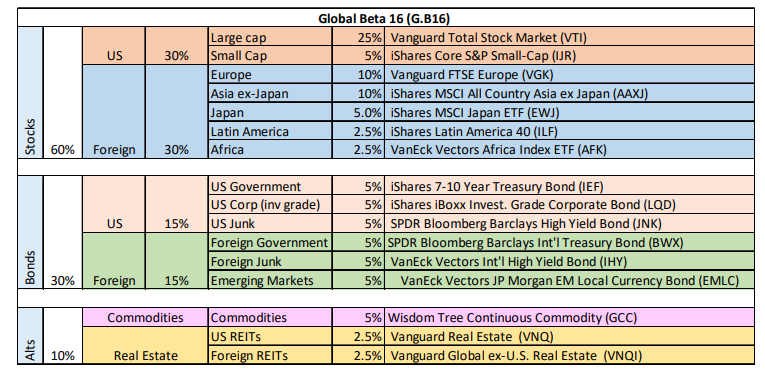
No one should be terribly surprised to find that with all slices of our 16-fund opportunity set tumbling this week, gravity pulled the portfolio benchmarks lower, too. The deepest cut was logged by Global Beta 16 (G.B16), which holds all the 16 funds in the table above (see weights below). The 1.5% weekly decline cut the benchmark’s year-to-date gain to 7.0%. That’s still a solid advance, but G.B16’s edge over its competitors is slipping.
We’ve seen this before, of course — markets correct, the crowd gets nervous, and then risk assets rally again. For the moment, that narrative’s as good as any, if only because it’s worked well for years. And it’ll continue to work -- until it doesn’t.
Meanwhile, the markets need a new stimulant and the cupboard’s looking bare. Or is it? President Biden is pushing his $2.3 trillion American Jobs Plan and there are signs that he’s making progress in convincing Congress to give it the green light in one form or another. Perhaps the party’s not quite over after all.