
The Credit Market Is Sending A Bullish Signal For SPY
The widely followed SPDR S&P 500 (NYSEARCA: SPY) is at a critical juncture. After a sharp crash in February-March and an impressive recovery since April, the ETF that replicates the S&P 500 index has been pulling back from its highs and breaking below some critical support levels in the short term.
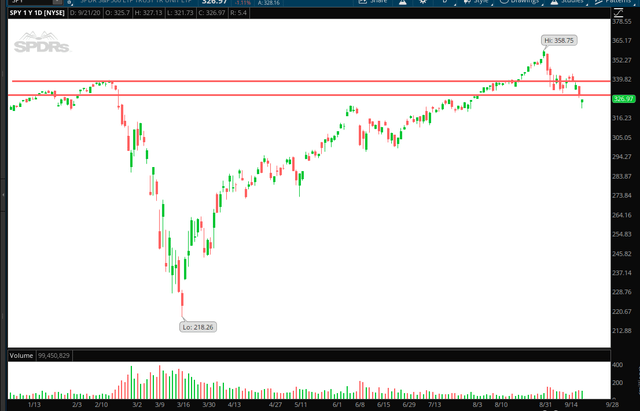
Source: TOS
The big question in everyone's minds is whether this is just a garden variety correction in the context of a long-term uptrend or the beginning of a deeper move down for SPY.
The future can never be known with precision, but we can get some clues from market indicators in order to assess risk appetite across different asset classes. Demand for risk in the debt market can be a major driver for SPY, and the debt market is currently sending a bullish signal.
The Smart Money
It is usually said that the bond market is smarter than the equity market. This could be an oversimplification, but it is true that the debt market moves enormous amounts of institutional money, and bond investors are generally more risk-conscious and focused on risk management than equity investors.
As a reference, we can see how the coronavirus-induced crash in SPY was signaled in advance by a sharp increase in credit spreads, as investors in the bond markets were rapidly looking for safety before things got really nasty for SPY.
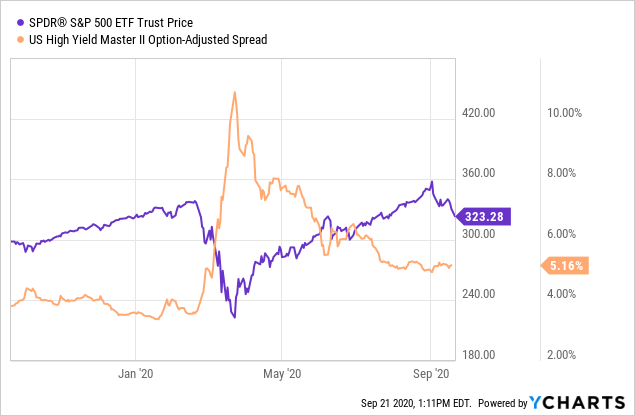
Data by YCharts
There are no magic rules or infallible signals in the market. However, when assessing the risk and reward potential in SPY going forward, it makes sense to also incorporate some signals from the credit markets in order to look at the whole picture with a bigger perspective.
Measuring The Trends
The Credit Market Model is a quantitative strategy that reads the signals from the credit market in order to enter and exit positions in SPY based on these signals. The main idea is assuming exposure to SPY when the debt market is showing a strong appetite for risk and protecting the portfolio when risk appetite is declining in the bond markets.
We begin by creating a ratio that measures the relative performance of iShares iBoxx $ High Yield Corporate Bond (NYSEARCA: HYG) versus iShares 7-10 Year Treasury Bond ETF (Nasdaq: IEF). When this ratio is rising, it means that high-yield bonds are outperforming Treasury bonds, so risk appetite is increasing in the debt markets.
The chart shows how the ratio has evolved since recent months with the 100-day moving average as a trend indicator in black. When the ratio is above the moving average, we could say the ratio is in an uptrend and sending a bullish signal for SPY.
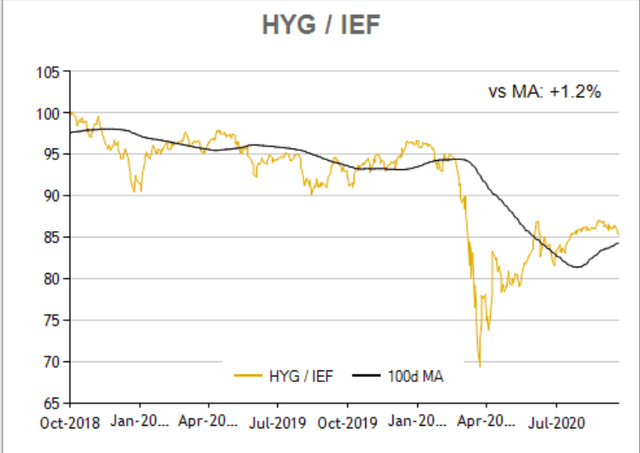
Source: ETF Replay
The following backtest is based on a remarkably simple strategy. When the ratio is above the 100-day moving average, the portfolio is invested in SPY, and when the ratio is below the 100-day moving average, the portfolio is positioned for safety in iShares 20+ Year Treasury Bond ETF (Nasdaq: TLT).
It's important to highlight that there is no market forecast or prediction whatsoever involved in the process. We just observe prices in the credit markets and rotate among SPY and TLT. The portfolio is rebalanced every month, so it doesn't require a lot of work for maintenance or trading activity.
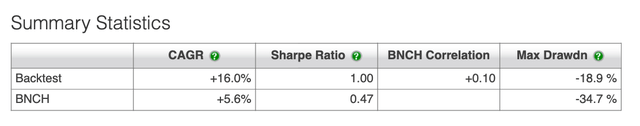
This simple system has produced a remarkably attractive risk and reward trade-off over the long term. Since 2008, the system gained 566%, far surpassing the 101% produced by a 60/40 benchmark in the same period. In annual terms, the quantitative system gained 16% versus 5.6% for the benchmark.
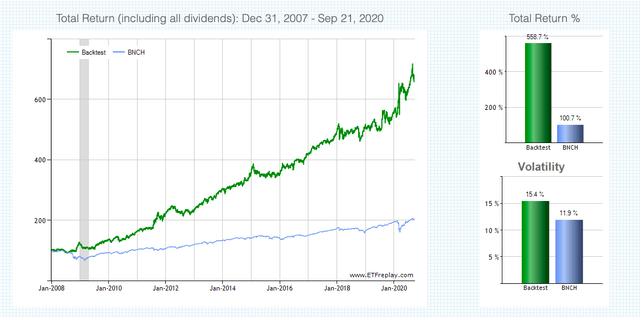
Source: ETFreplay
The maximum drawdown, meaning maximum decline from the peak, was 18.9% for the quantitative strategy versus 34.7% for the benchmark over the backtesting period.
Source: ETF Replay
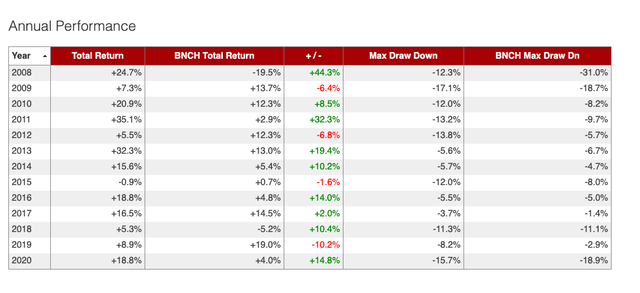
Looking at performance over different years, the strategy tends to do a great job of protecting the portfolio in big risk-off years such as 2008 and also benefitting from strong rallies for SPY during well-defined uptrends in years such as 2016 and 2017.
In years like 2015, on the other hand, when markets are moving sideways and price trends are short-lived, a strategy such as this one can be expected to produce lots of false signals and ultimately disappointing returns.
More recently, the strategy was positioned in TLT at the end of January of this year, so it even benefitted as SPY crushed and TLT surged in February and March. During the recovery, the strategy entered back into SPY at the end of June, which was quite a slow reaction to the new uptrend in risk appetite.
But, still, returns are very good in 2020 so far, with the strategy gaining 18.8% versus 4% for the benchmark on a year-to-date basis.
Source: ETFreplay
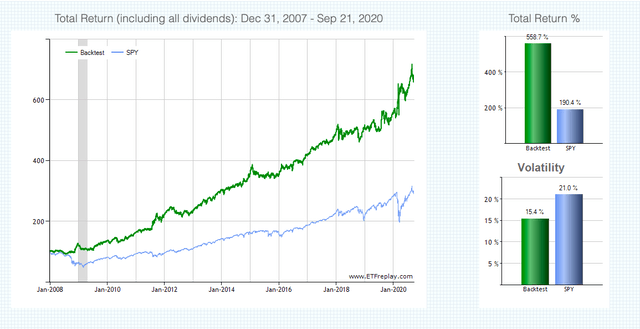
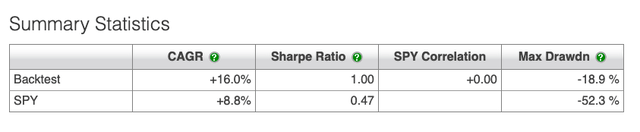
If we compare the quantitative strategy versus a buy and hold position in SPY, the numbers are also far superior. The annual return is 16% for the strategy versus 8.8% for SPY, and the maximum drawdown is 18.9% for the strategy versus a maximum drawdown of 52.3% for SPY in the same period.
Source: ETF Replay
The Signals Are Still Bullish
The fact that the Federal Reserve is buying different kinds of bonds in different quantities can make the signals from the Credit Market Model more noisy and unreliable. If bond yields are being targeted by the Fed, then this can affect their validity as market indicators based on real-time market pricing.
However, the economic rationale behind the model is still valid. We have a recession caused by a pandemic, and this produces declining revenues for companies in different sectors of the economy. When companies with declining revenue lack access to credit, then they need to focus on cutting costs as much as possible, usually firing lots of employees, which creates a vicious cycle and makes the recession worse. Importantly, credit problems can turn a recession into a full-blown financial crisis when companies can't pay their debts or refinance them over time.
Alternatively, when companies and consumers still have access to credit, be it because of the Fed or for any other reason, this makes things very different, and the impact of the economic decline is significantly contained when credit remains available during a recession.
Focusing on the past several weeks, we can see that SPY has been rising, while high yield credits spreads have been declining over recent months. Then, SPY peaked on September 2, and high-yield spreads stopped declining at that point, but there is still not much stress in the credit markets.
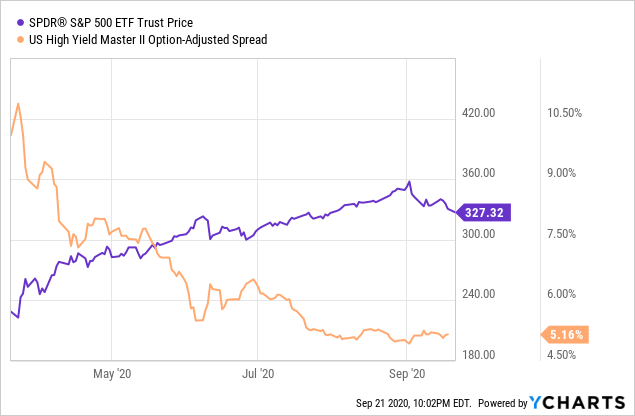
Data by YCharts
If past history is any valid guide for the future, then the fact that credit spreads remain contained that and credit is flowing through the system should mean that the recent selloff in SPY is a short-term pullback as opposed to a long-term bear market.
As always, if the evidence changes, then we need to change our minds, and a deterioration in the credit market would be a major red flag in my assessment of market conditions for SPY. But it is what it is right now, and strong risk appetite among bond investors is bullish for SPY as of the time of this writing.
Disclosure: I/we have no positions in any stocks mentioned, and no plans to initiate any positions within the next 72 hours.
Disclaimer: I wrote this article myself, and it expresses my own ...
more

