
Tech Ideas For Those Who Are Worried About High Valuations
Tech has been a terrific place to be for a while now, and still is. Traditionally, though, this area has been off-putting to those concerned about value, whether in the traditional academic sense that requires low ratios, or in the theoretically sound sense that requires investors to face the challenges of making necessary assumptions about future growth. This disconnect need not exist, however. Value investors can filter for emerging growth opportunities and look for appealing valuations within that particular subset of the market.

© Can Stock Photo / sergey150770
Value Without Growth Is Not Really Value
There are many out there who see value and growth as being opposed styles, and in some cases, downright antagonistic. That’s wrong.
The correct valuation for a stock is not an arbitrarily chosen low number, or even a low rank relative to other valuations in the market. An appealing value is one in which the price of a stock is appealing relative to expected future growth (this is important — growth is the only factor that can justify buying equities in lieu of typically better-yielding less-risky fixed income) and business risk. That does not lend itself to simply plugging numbers into a spreadsheet. It requires investors to search for indirect clues that future expectations are favorable.
Screening For Emerging Tech Values
The Chaikin 20-factor fundamental-technical Power Gauge model finds its clues in historical growth figures analyzed in such a way that makes it better representative of potential future outcomes and on sentiment/market data that taps into market expectations (a wisdom-of-the-crowd sort of approach).
The Power Gauge model is such that stocks ranked Bullish or Very Bullish are likely to achieve their ranks by scoring well on a variety of the model’s “future-growth-proxy” factors. Not all score well, however, on the value-oriented factors. But enough do that we can, indeed, screen for growth-value ideas.
I chose to screen specifically for Bullish or Very Bullish overall Power Gauge ranks and also for Bullish or very Bullish sub-ranks in our Price/Sales factor (the numerator for which is actually more akin to enterprise value than market cap). I prefer this for situations like emerging tech, where the earnings stream into which investors buy is more future- than present-oriented. It also gets us away from problems involving non-physical assets such as intellectual property (that can plague price/book) and the requirement that research and development be expensed immediately rather than capitalized, which tends to depress reported tech earnings relative to earnings of companies whose investments in future growth are, for accounting purposes, spread over many years.
In terms of defining emerging growth, I decided to refrain from sector/industry categories per se, which include innovative tech, established tech, and also over-the-hill tech. Instead, I used, as a screening universe, the constituent list for the S&P FactSet Innovative Technology ETF (XITK) (ETF Home), an intriguing offering in its own right which is ranked bullish under our ETF Power Rank model. In the words of the ETF provider, the fund invests in “Technology companies and Technology-related companies (including Electronic Media companies) within the most innovative segments of the Technology sector and Electronic Media sub-sector of the Media sector, as defined by FactSet Research Systems, Inc.”
(Click on image to enlarge)

I like the ETF itself and have a long position in it. But it does hold positions with valuations above what many are comfortable with. The largest portfolio holding, at 3.5%, is Zoom (ZM), with a price/sales ratio of you-really-don’t-want-to-know (Hint: It’s not between zero and 100).
Five Ideas
These are value ideas drawn from a universe of innovation defined by the ETF (obviously, you won’t be seeing ZM among the results of the screen). In the alternative, you could view these in terms of a possible core-satellite setup; value-oriented satellite positions to accompany a core position in XITK.
Cohu Inc. (COHU)
(Click on image to enlarge)

Semiconductors (chips) are a key part of manufactured goods and in this day and age, considering the kinds of goods we’re making and buying (intelligent this, intelligent that, faster intelligence, more intelligent, etc.), one could say the health of the chip market is emblematic of the health of business activity in general (much the way past generations talked about steel). COHU doesn’t make chips. Instead, it sells to chipmakers; it makes equipment used to test and inspect chips and printed circuit boards (things to which chips are affixed). End markets (goods using chips) of particular interest to COHU include migration to 5G, auto intelligence, and the work-from-home phenomenon. As a small-cap (with all that implies in terms of fixed costs and scale), COHU stock hasn’t gotten much attention in recent years. But with exposure to attractive areas and a price/sales ratio of 1.37, this issue qualifies quite well as an emerging-tech “value.”
J2 Global (JCOM)
(Click on image to enlarge)
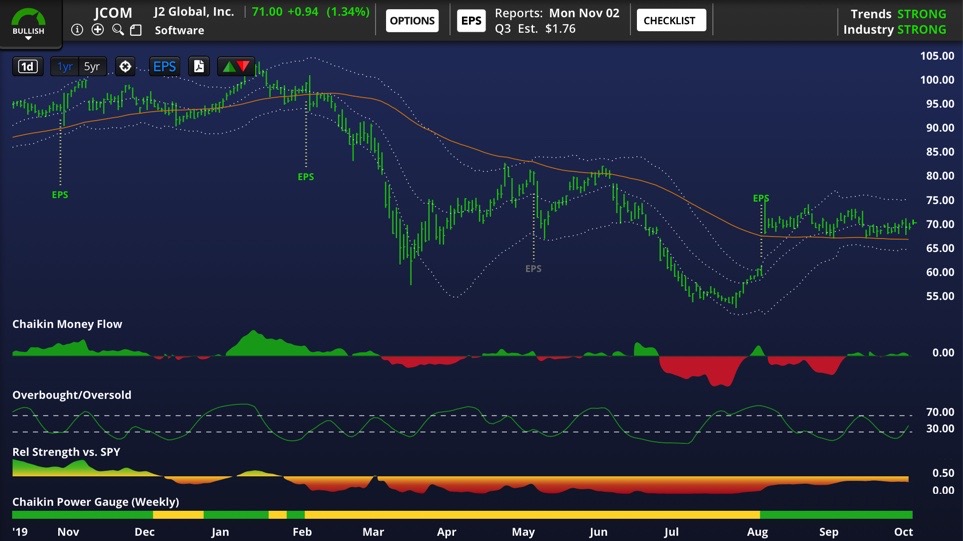
I guess we might call JCOM a 21st century conglomerate (I really hope nobody at JCOM sees this and flames me for using the dreaded “c” word). It has a bunch of businesses grouped into five segments: Technology (digital media; let’s say electronic magazines and sales circulars), Health (a collection of health-information web sites, the kind you see if you search Google to look up a health condition); Security (VPN services, digital storage, etc.); Communications (online faxing, messaging, phone-type services), and Martech (tools that help small- and mid-size businesses attract and interact with customers). It tends to grow by acquisition. All in all, do you see why I used the c-word? But unlike the long-gone but not-mourned 20th-century conglomerates, JCOM is profitable (its Power Gauge factor rank for Return on Equity is Very Bullish) and growing (it’s five-factor Earning Growth Power Gauge rank is also Very Bullish). At 2.31, its price/sales ratio may not seem cigar-butt-value-like, but in this day and age, when compared to everything else in the market, that factor score comes out Very Bullish as well.
Note though that a while back, a short seller came out with a hit piece accusing management of self dealing and inadequate impairment of goodwill impairment. Nothing came of it, as often happens with these attack. But be aware it’s been out there.
Plantronics (PLT)
(Click on image to enlarge)

PLT’s 0.34 Price/Sales ratio tells us a lot, and no, its not telling us that the stock is a no-brainer Buy. It may well be a Buy (the Power Gauge rank is “Bullish”), but such a trade will need to be supported by brainpower. No matter what the gurus say, Mr. Market is not going to hand you a 0.34 Price/Sales ratio without expecting you to take on some baggage. Here, the baggage is the lingering financial impact of the company’s huge 2018 acquisition of Polycom, which broadened the product line, boosted sales, but also resulted in big increases in debt and R&D such as to drive a formerly-profitable income statement into the red. For today’s investment theme — future growth powered by emerging tech — I can and often do live with current red ink; its part of the landscape, so long as we have credible expectations that the company can grow its way to good profitability down the road, an especially noteworthy concern for small caps such as PLT, where fixed-cost burdens are commonplace. The story here involves contemporary communications, headsets, conference-call hardware, desktop phones, etc. With COVID-induced work at home, equipping for this activity has become a hot trend. COVID won’t last forever (so we all hope and presume), but although there may be a deceleration in distributed work groups, society is coming to realize there are a lot of benefits to the sort of workplace re-evaluations COVID forced on us, and many expect long-term re-thinking along these lines. PLT can’t at this time support such an investment case with current numbers. I can say, however, the the “Bullish” Power Gauge is being driven by valuation (on all ratios, not just P/S) and also by a “Very Bullish” rank in the five-factor Technicals category. That means we’re working with a wisdom-of-crowds type of market judgment. This is completely alien to academic notions of value investing, but it’s not as if those folks been setting the world in fire lately. If you want to try the sort of theory-expectations based approach to value I described above, let’s call this a high-risk/high-potential play in this area (the material to which I linked above also explains that low valuations are associated with higher business risk).
SS&C Technologies (SSNC)
(Click on image to enlarge)
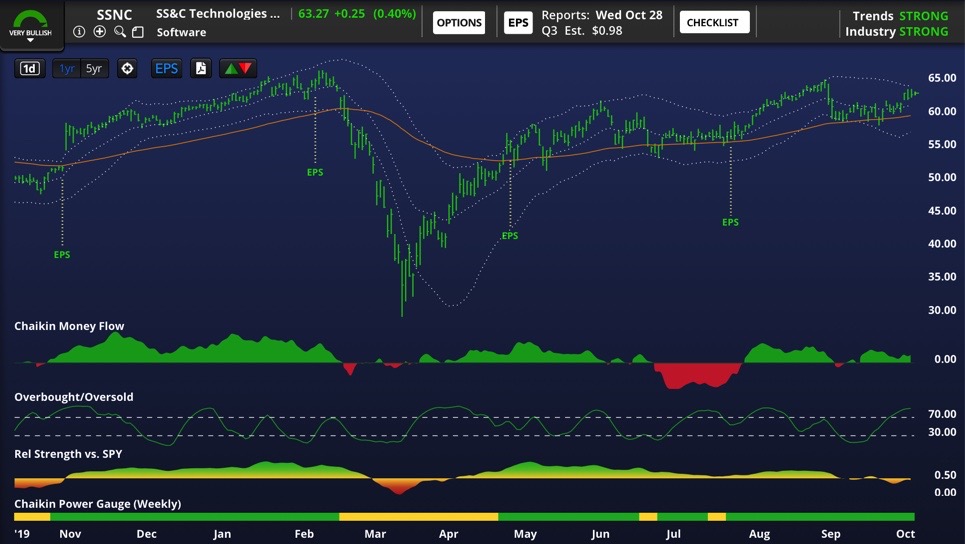
As value plays go, SSNC’s price/sales ratio of 3.49 puts it on the aggressive side of the spectrum. But the way things are nowadays, when we compare that to what else is out there, the P/S Power Gauge factor rank still winds up with a Bullish rating. The core of this company’s business is software, mainly accounting for investment managers and funds. Hedge funds and mutual funds comprise big areas for SSNC. Billing is not directly tied to asset size but as assets under management rise, fees charged by SSNC become less burdensome, so the company is leveraged a bit to asset growth (and if it’s not always in the equities asset class, that’s OK for SSNC). This is a sticky area since its often more trouble than its worth for a fund to switch systems. Meanwhile, the company is an acquirer and is expanding in the health care area.
Teradata (TDC)
(Click on image to enlarge)
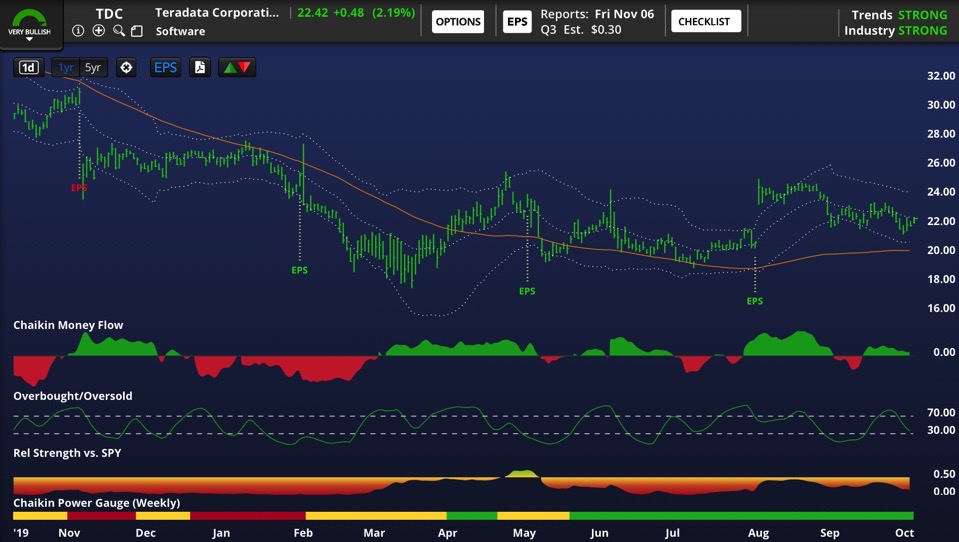
This company is going through the challenge of changing its business model. This likely accounts for the low 1.30 price/sales ratio. The company is, quite literally, about data, initially data warehousing and now, primarily data analytics. This sounds like a big snooze to those who don’t work with data in a serious way (other than to scream about social media companies monetizing one’s personal data). Actually, though, it’s an extremely intricate field with different kinds of data serving different kinds of needs. Once upon a time, companies need to find ways to store enterprise-wide data in ways that would be efficient notwithstanding different data types for different organizational functions. That problem was solved long ago. But now, we’re facing similar issues for analytic tools; the need for enterprise analysis solutions that can work across different functions. That’s where TDC lives through its Vantage offering. The challenge today is for TDC to migrate from a perpetual license model (the functional equivalent of what in ancient times amounted to one-time transactions in which software providers sold program discs) and consulting services to a subscription model with its stream of recurring revenue. TDC did not, as many readers undoubtedly know, invent this approach. But it is the way it has to go, even despite the lumps it takes as the pace of decline in perpetual license and consulting revenue at times outstrips gains in subscription. The company did, however, beat expectations in the latest quarter. The fact that the current CEO is new on the job, as of June 8, 2020, adds credibility tot he story — management change is one of the first things I look for in companies that talk about reinventing themselves (to address the “If you couldn’t do it before, why should I believe you can do it now?” question).
Disclosure: Long XITK.
Disclaimer: None.


