
Stocks Got Crushed, And The Line In The Sand Is Drawn

|
|
Well, that was fun. I almost forgot what a 3% decline felt like, no so bad, right? We all survived. Algo’s and ETF’s can work wonders during times of uncertainty, and they are all programmed to find those levels.
Anyway, I’m somewhat annoyed at myself for not being more on top of this pullback. But I didn’t see the same signs that I would normally see. There was only some minor VIX (VIX) buying; the S&P 500 wasn’t even in an overbought condition. Plus, a whole host of other things I watch. I guess it happens, and nobody is perfect. Additionally, everytime you try to defy the market, it makes you look foolish. Anyway, I went over a playbook of things I’m watching at this point to gauge the sell-off.
S&P 500 (SPY)
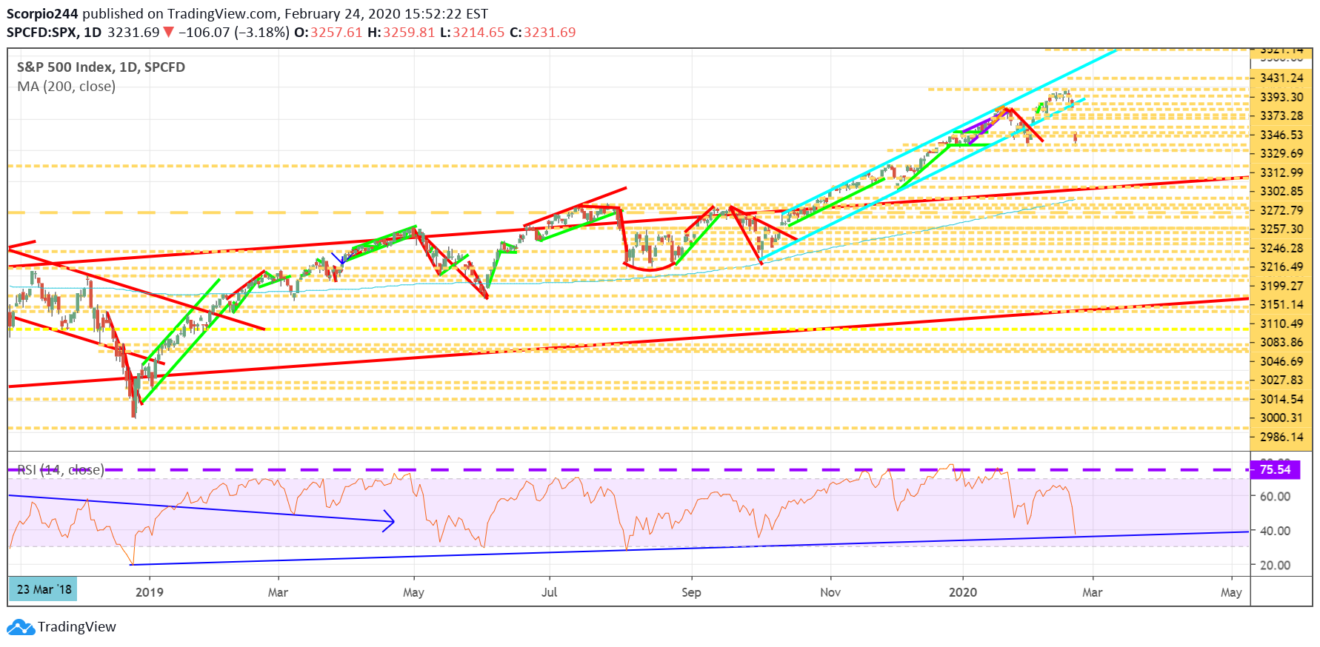
I noted in the mid-day update that the S&P 500 was at a critical juncture, and to this point, it has held. The magical level today was at 3,216, why because that was the low on January 31, and it was a pretty firm level of support. So for me, that has pretty much become my line in the sand, if we break 3216, I think the declines have much further to go maybe to 3150.
The uptrend is clearly broken now, so we are going to have re-assess this over the coming days.
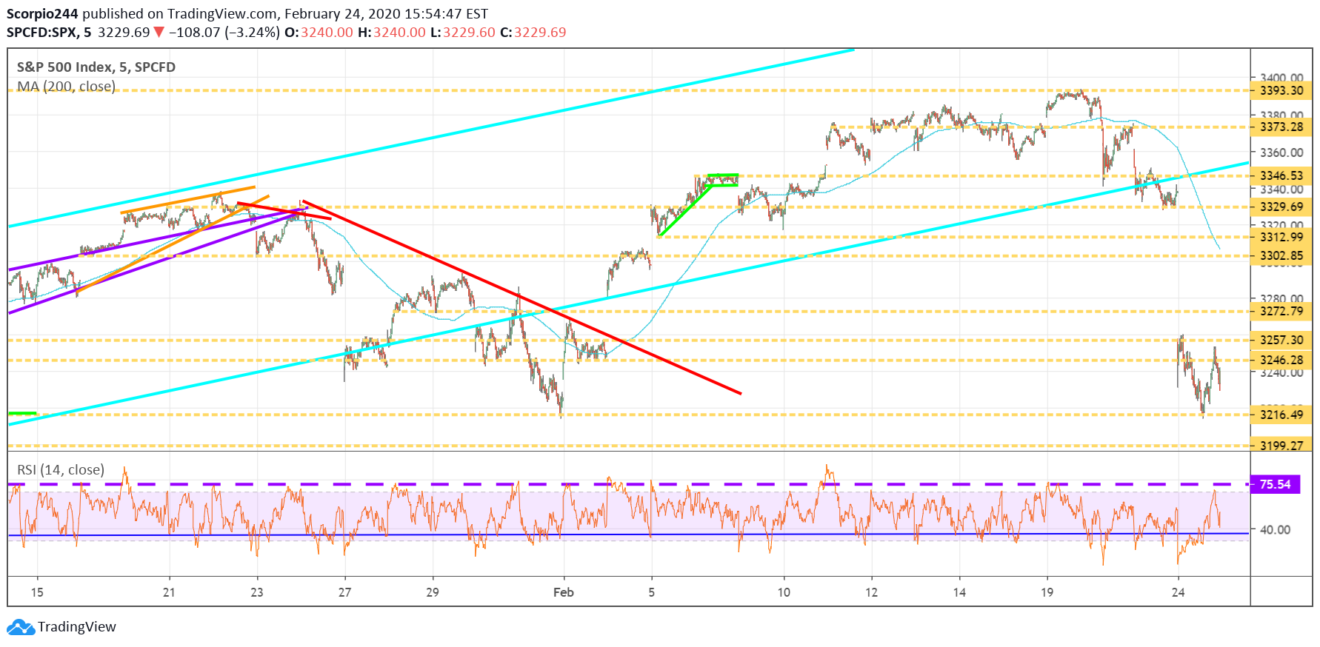
The RSI does hold the uptrend from the 2018 lows, and that does matter to some degree.
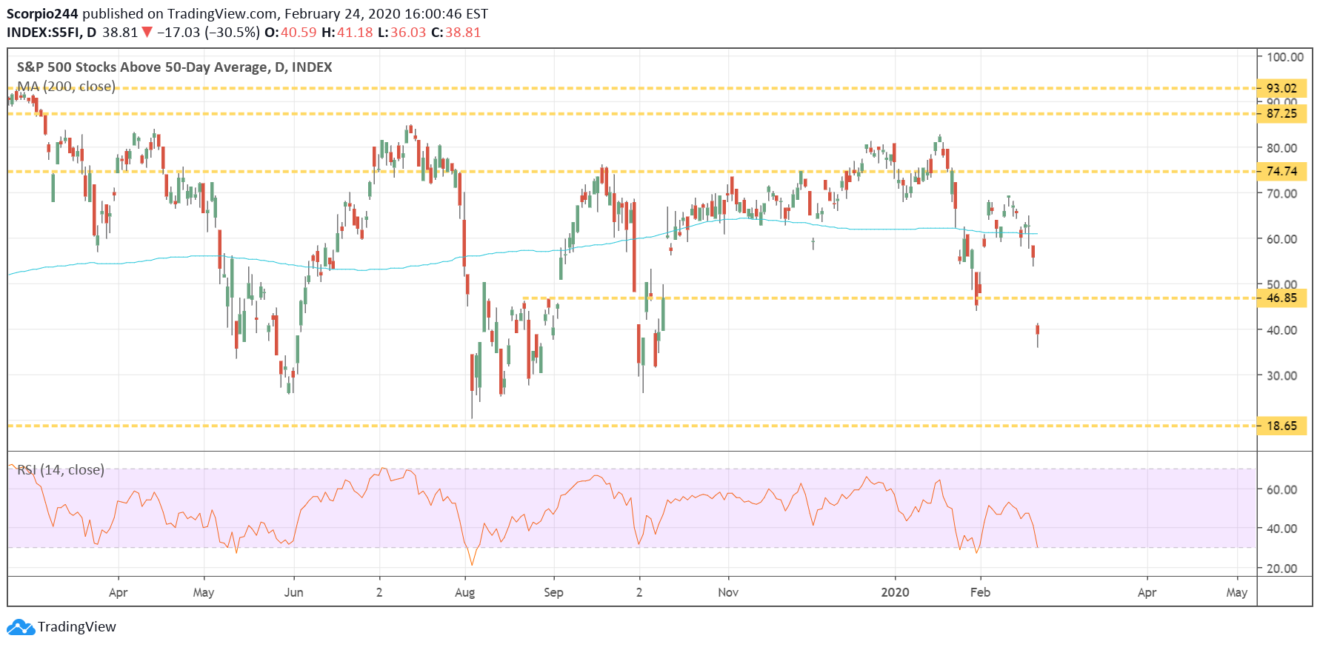
50 DMA
The number of stocks below their 50-day moving average fell to 38.8% today, which is low but may not be low enough. Typically we have seen this number drop to 25% to 30% region.
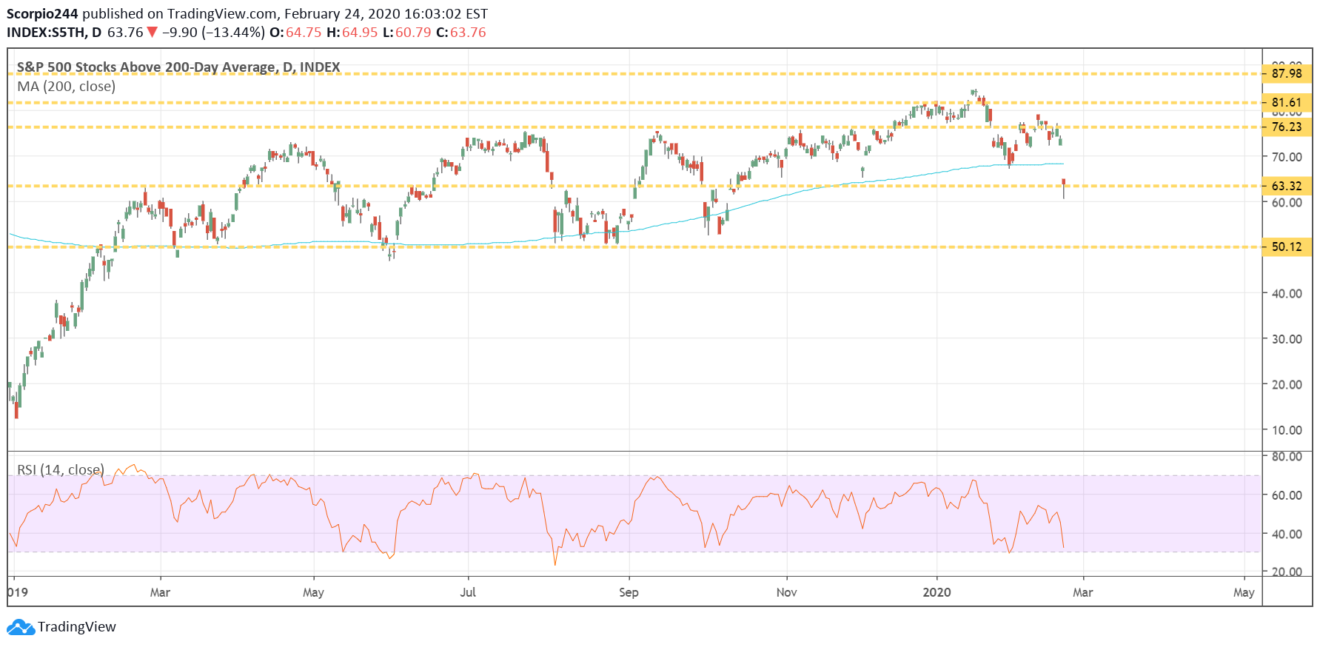
200 DMA
The number of stocks above their 200-day moving average fell to around 64%. Typically, that has fallen to about 50% to bottom.
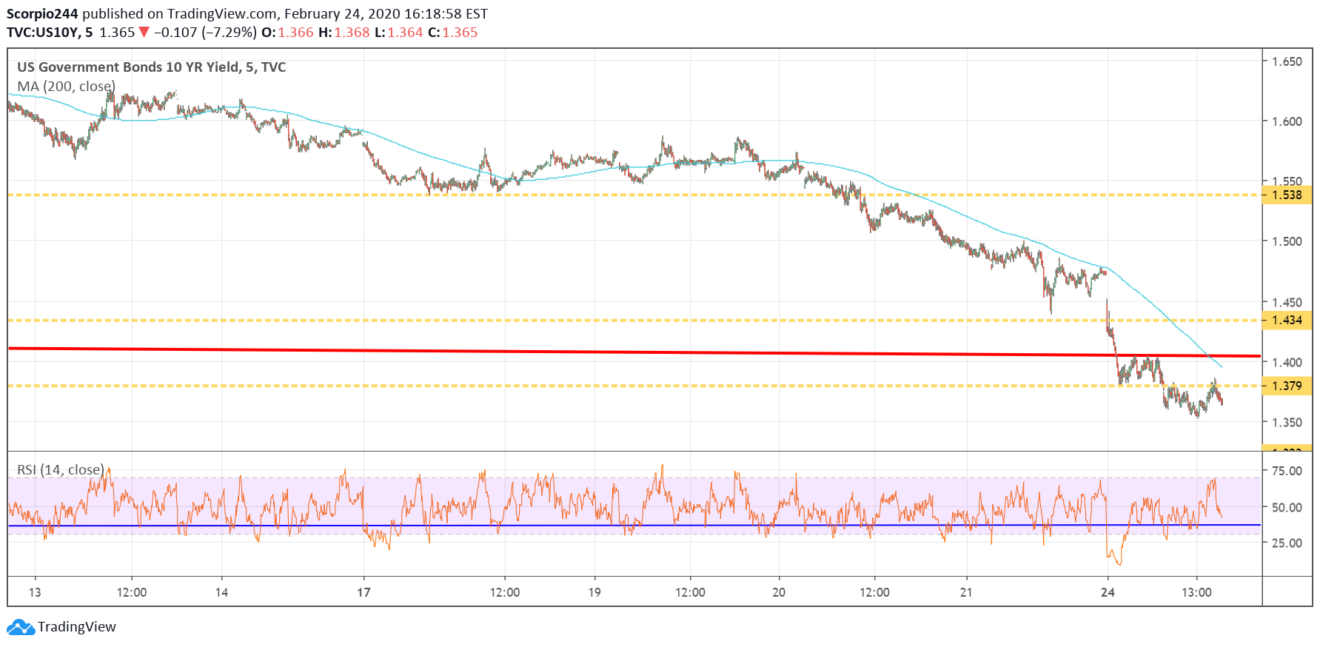
Yields
The thing that bothers me the most is what will happen if the 10-year takes out the 2016 lows around 1.32%. The signal it is likely to send to the equity market is not going to be good, and it is most likely going to hurt the bank stocks.
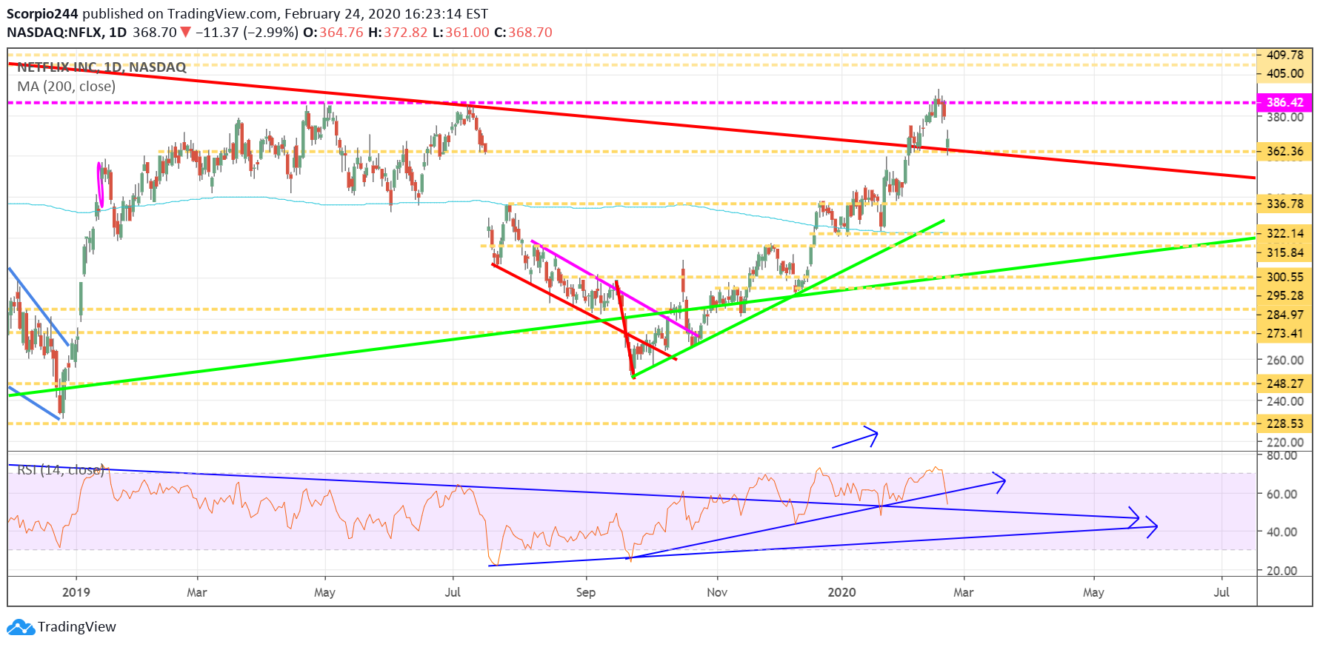
Netflix (NFLX)
Netflix fell today and tested support around $360, and it held. At least for now, the trends are still higher.
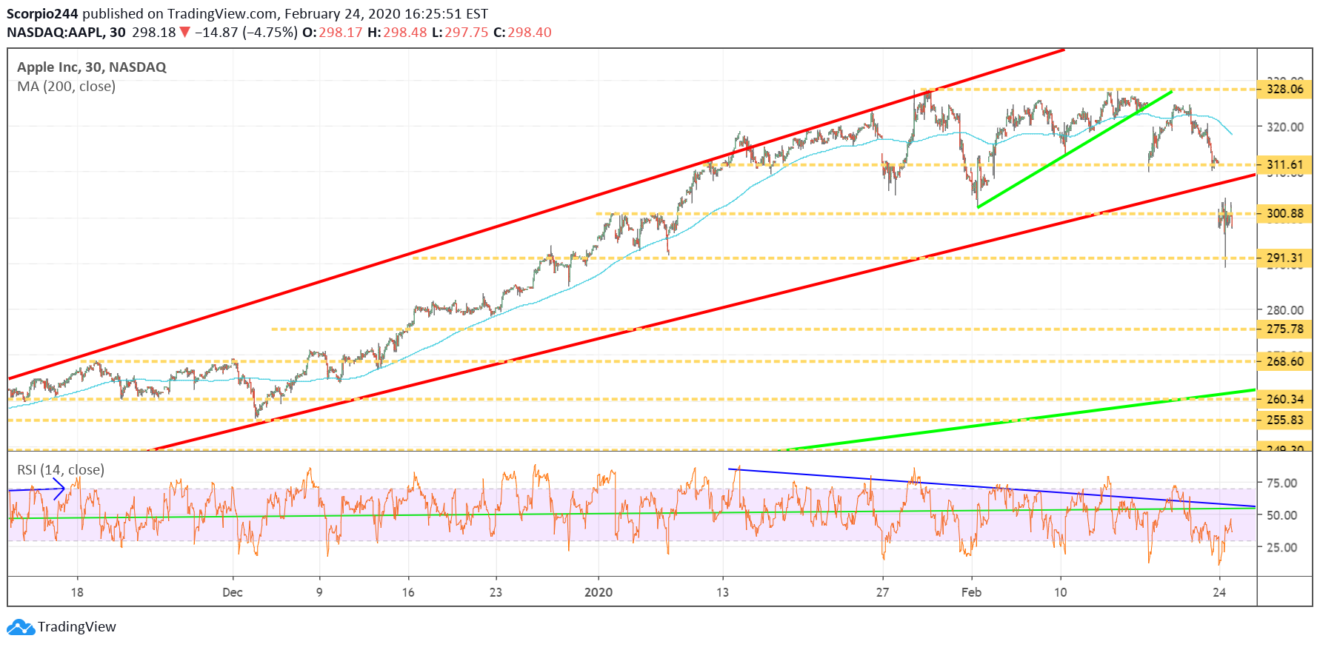
Apple (AAPL)
The good news is that Apple also found and held support at around $300.
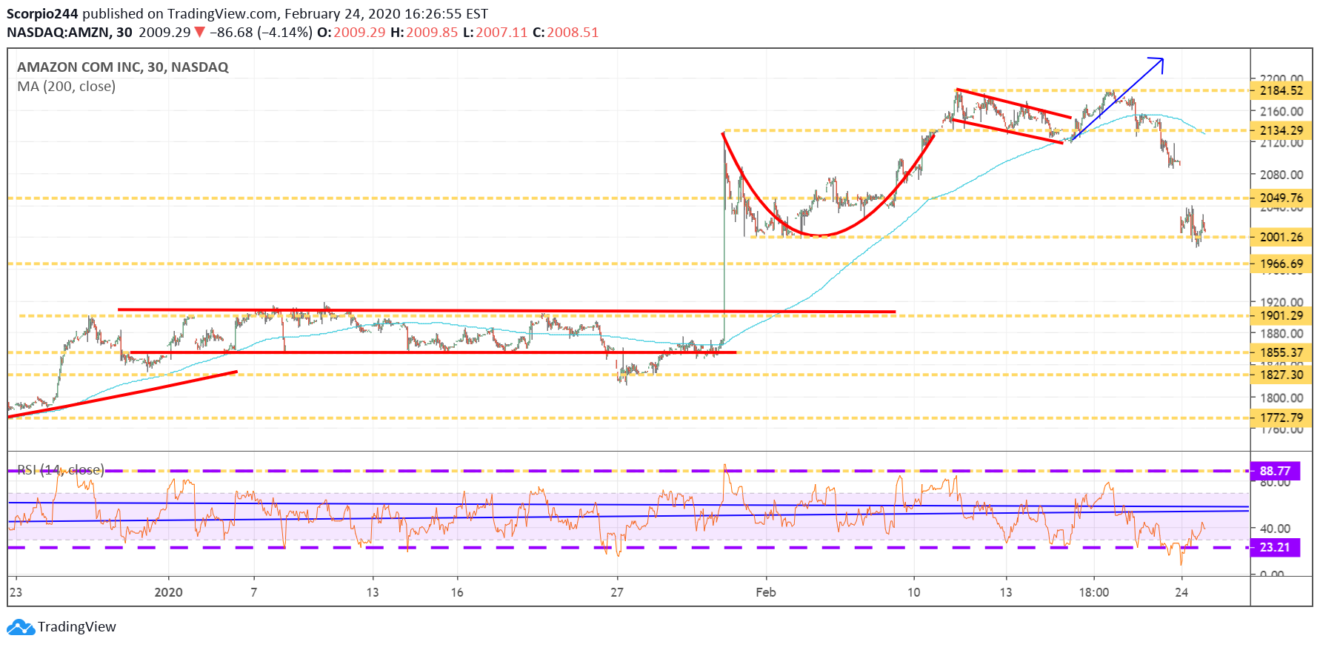
Amazon (AMZN)
Amazon fell to support at $2,000 today, and just stayed there too.
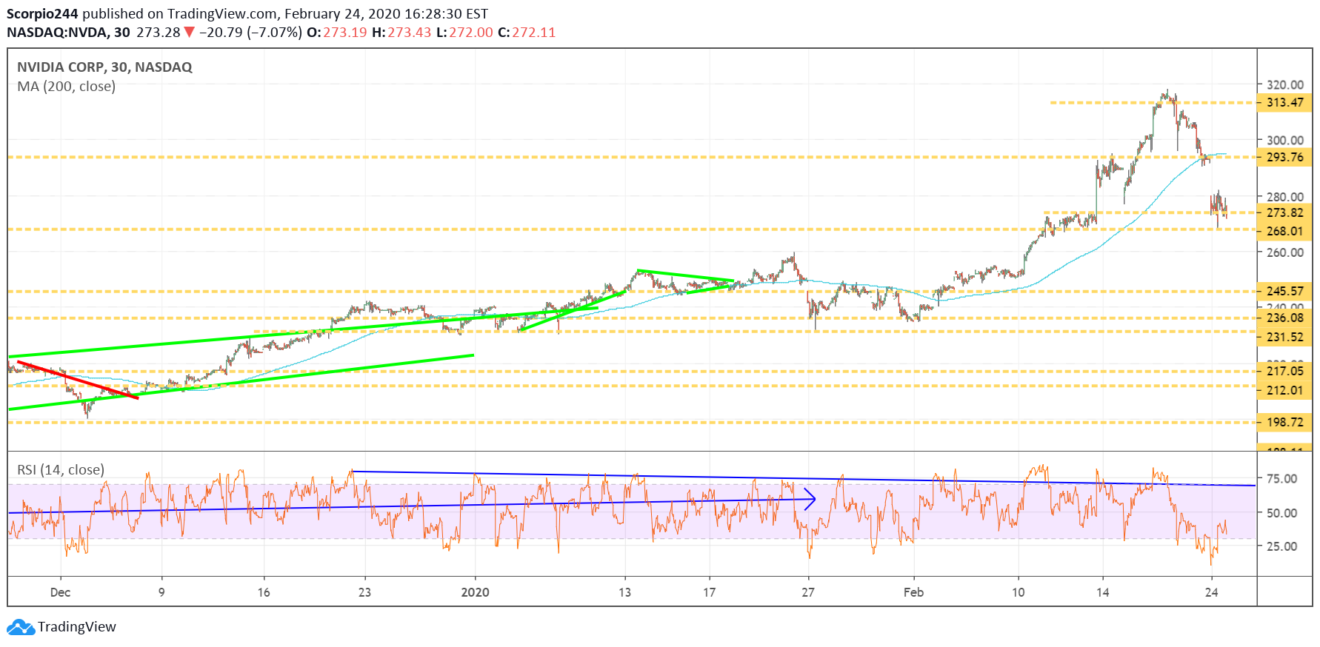
Nvidia (NVDA)
Nvidia also fell to support at $273 and again held.
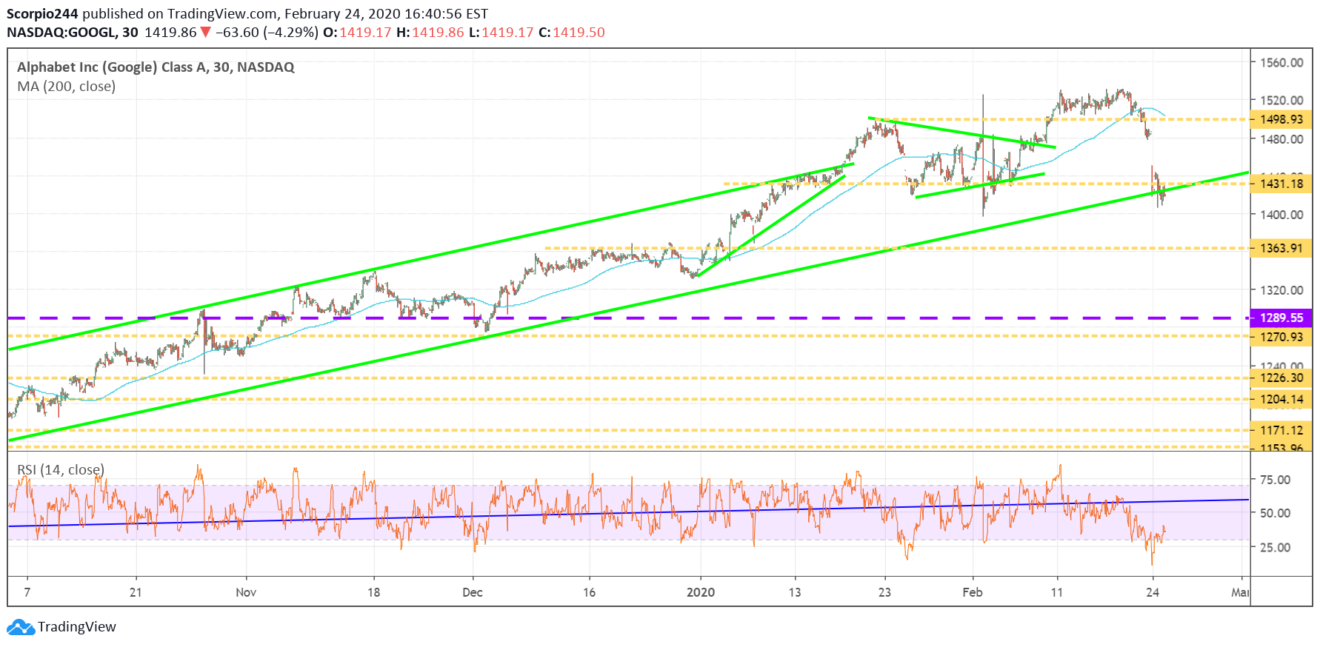
Alphabet (GOOGL)
Additionally, we saw something similar in Alphabet around $1,430.
Microsoft (MSFT)
Meanwhile, Microsoft found support at around $170.
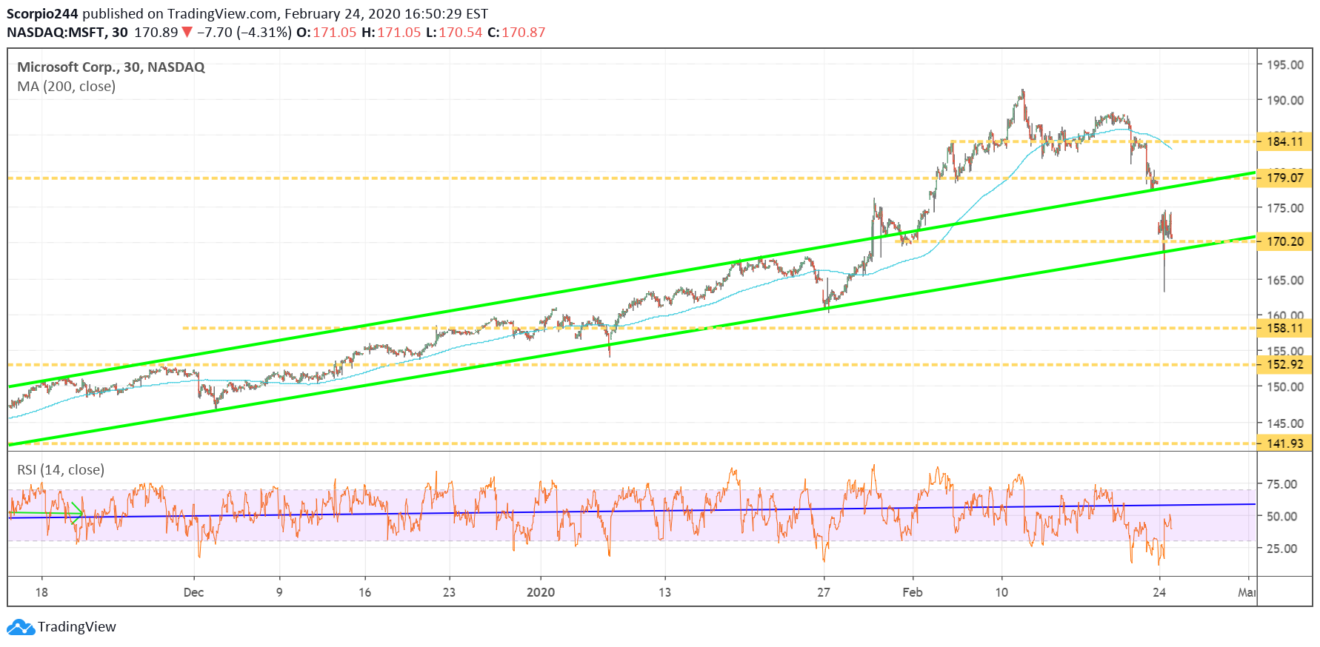
Anyway, I point that out because I found it interesting that the four largest companies by market cap traded down, but stabilized. Meanwhile, at least Netflix and Nvidia, two stocks that have had significant run-ups were similar. So I think of these stocks, especially the big 4, as the generals, and wherever they go, so too goes the market.
Get some rest tonight; you might need it tomorrow.
Disclaimer: This article is my opinion and expresses my views. Those views can change at a moment's notice when the market changes. I am not right all the time and I do not expect to be. I ...
more

