
SPX, Interest Rates And Sector Spiders Targets For The Week Of October 8th
This week we’ll dig deeper into the SPX and sector funds and will split the analysis into two parts.
Saturday: SPX, interest rates and sector spiders.
Sunday/Monday: Oil, Gold and G6 currency pairs.
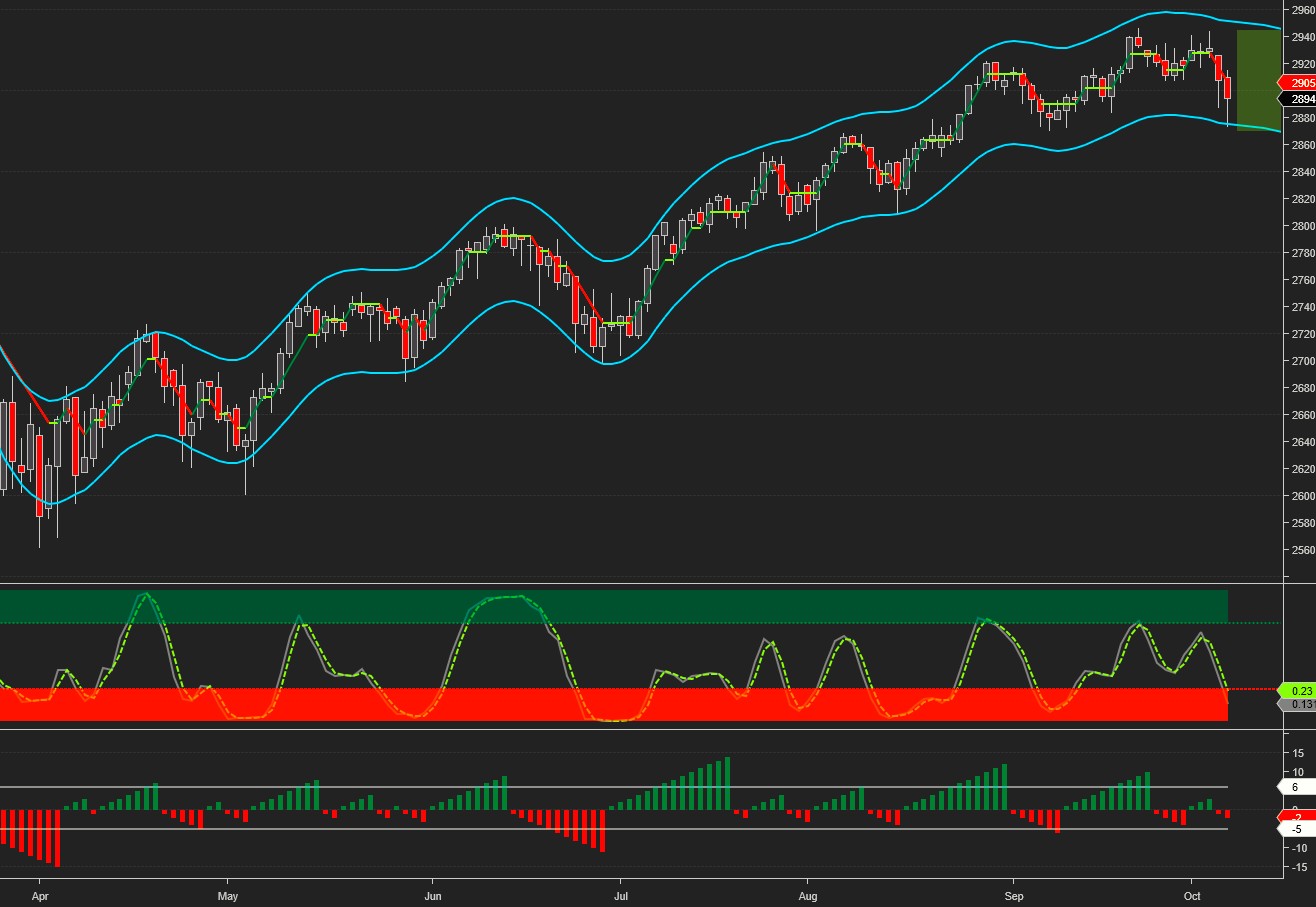
The SPX reached our weekly downside target on Friday and staged a late day rebound. More importantly, however, despite the pull-back it finished the week above 2880 and above the January highs.
For reader convenience, we’re adding the current weekly and daily swing trading signals. Please note that these signals are in effect as of the close on Friday and may change as soon as the markets re-open. Also, keep in mind that these are short-term swing signals, and one should never lose track of the long-term trend and the higher time frame signal.
The CIT SAR signals are based on the interaction between price and angles drawn from swing highs and lows. On the chart they are color coded as green/buy, red/sell and yellow/hold. When the current signal is hold, we also include the preceding buy or sell signal (e.g. Buy/Hold or Sell/Hold). Hold signals followed by a buy/sell signal in the direction of the preceding buy/sell signal can be considered for pyramiding the position.
Current SPX signals: Daily Sell, Weekly Sell, Monthly Buy/Hold
Average up/down swing duration daily: 6/5, weekly: 7/3
Average up/down swing gain/loss daily: 1.62%/-1.7%, weekly: 3.91%/-2.12%
Monthly CIT pivot for SPX at 2916, S1 – 2878, R1 – 2953
The next SPX CIT date is October 9.
The projected trading range for next week for SPX is 2870-2945:
The SPX sell-off was attributed to sharply rising interest rates.
The chart below points to a 3.33 short-term and 4.15 long-term 10 year yield target:

Next, we’ll focus on sector spiders and when their downturns occurred in 2000 and 2008 relative to the SPX.
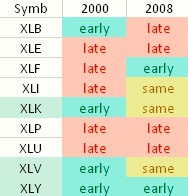
To summarize, in 2000 the XLB, XLK, XLV and XLY turned down before the SPX, while in 2008 the downturn was led by XLF and XLY.
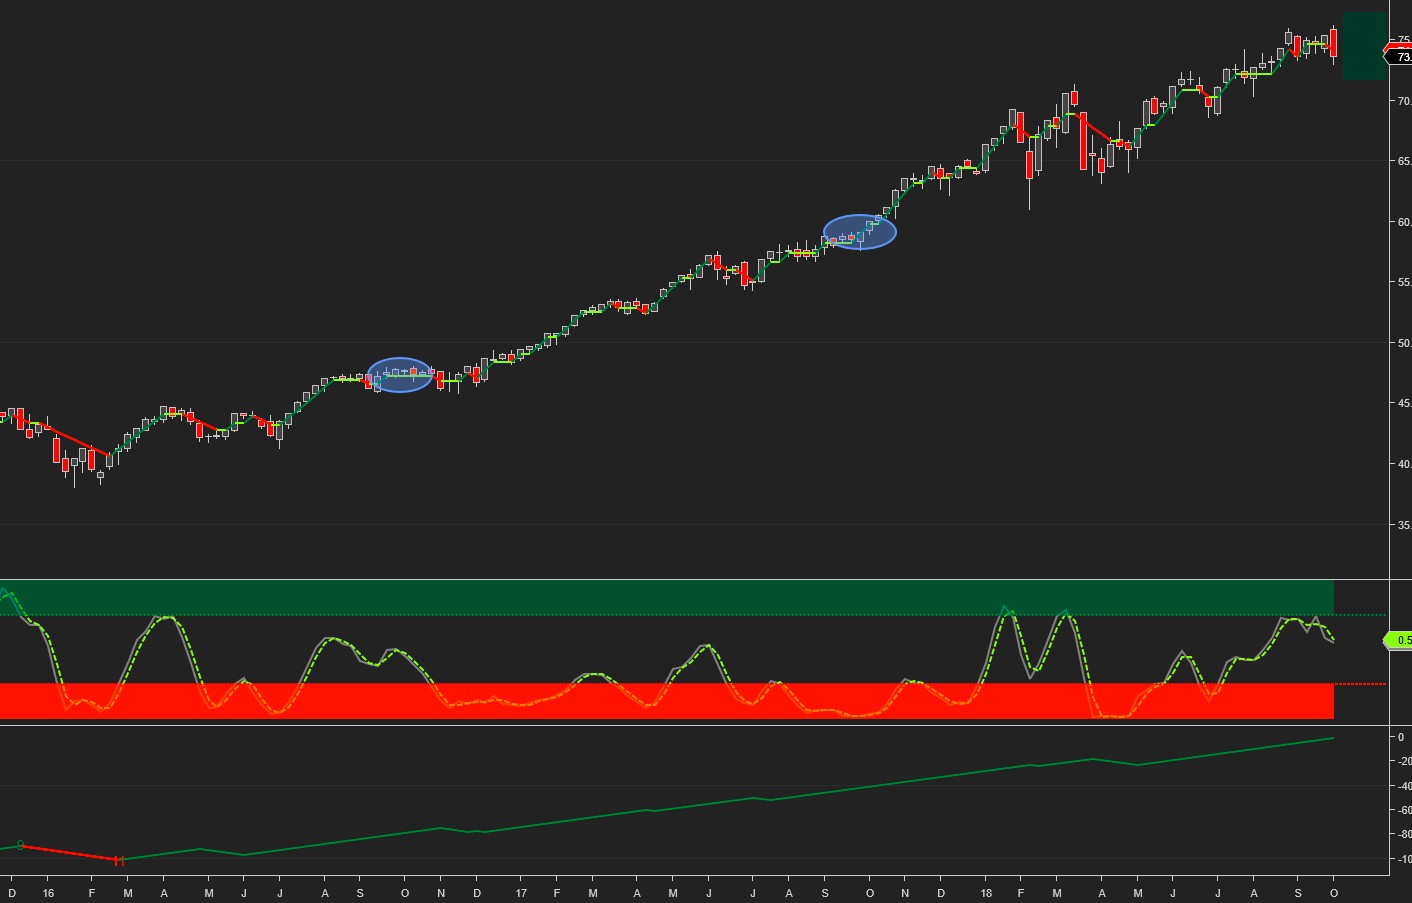
XLB made a high at the same time with the SPX in January ‘18, and has been trading in a box ever since. A break below 55 will turn the outlook negative:
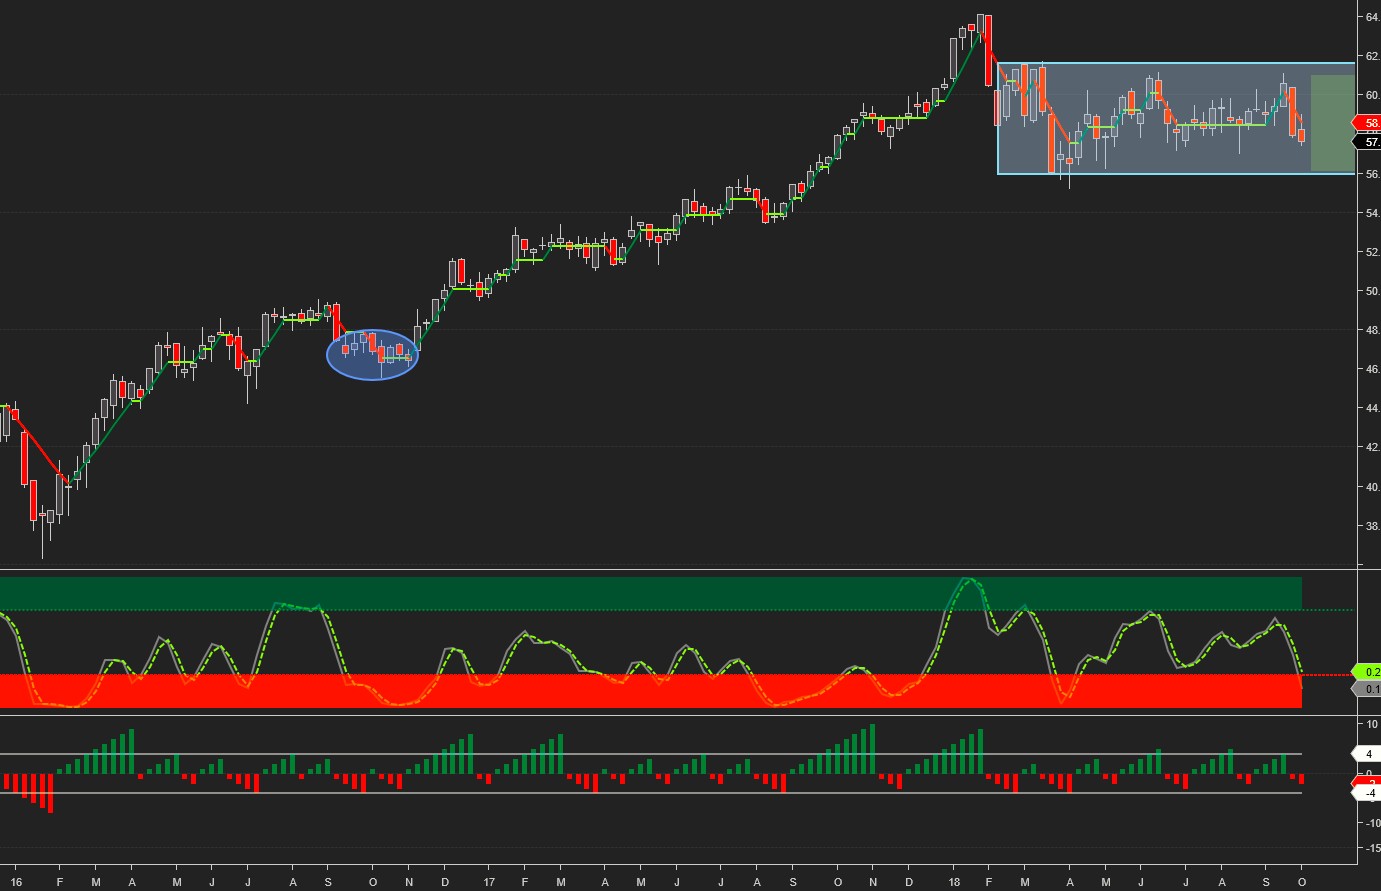
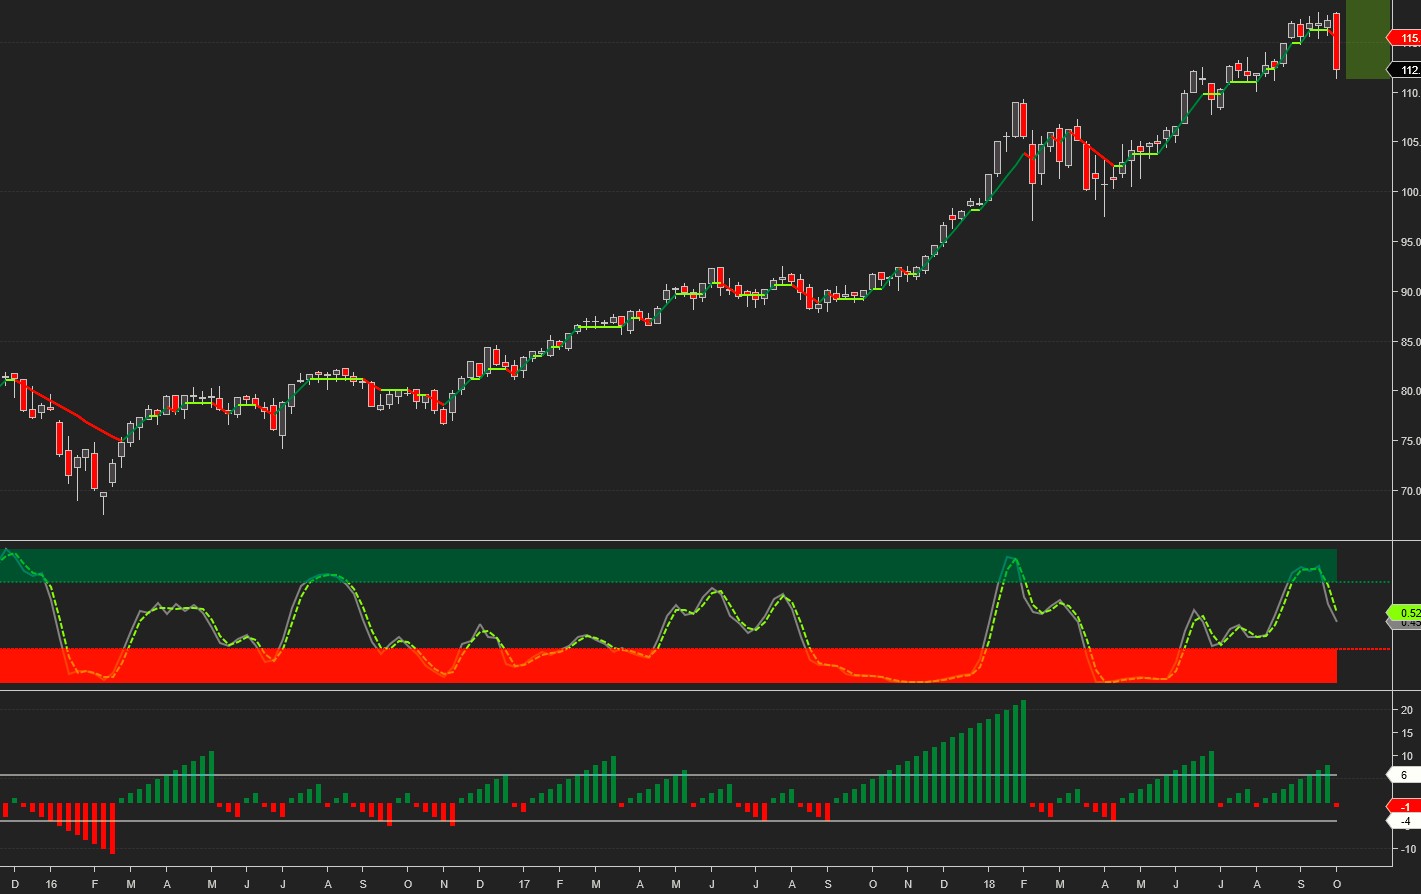
XLF is behaving similarly to XLB. It made an all-time high in January and has been trading flat since then. A break below the July lows will turn the outlook negative:
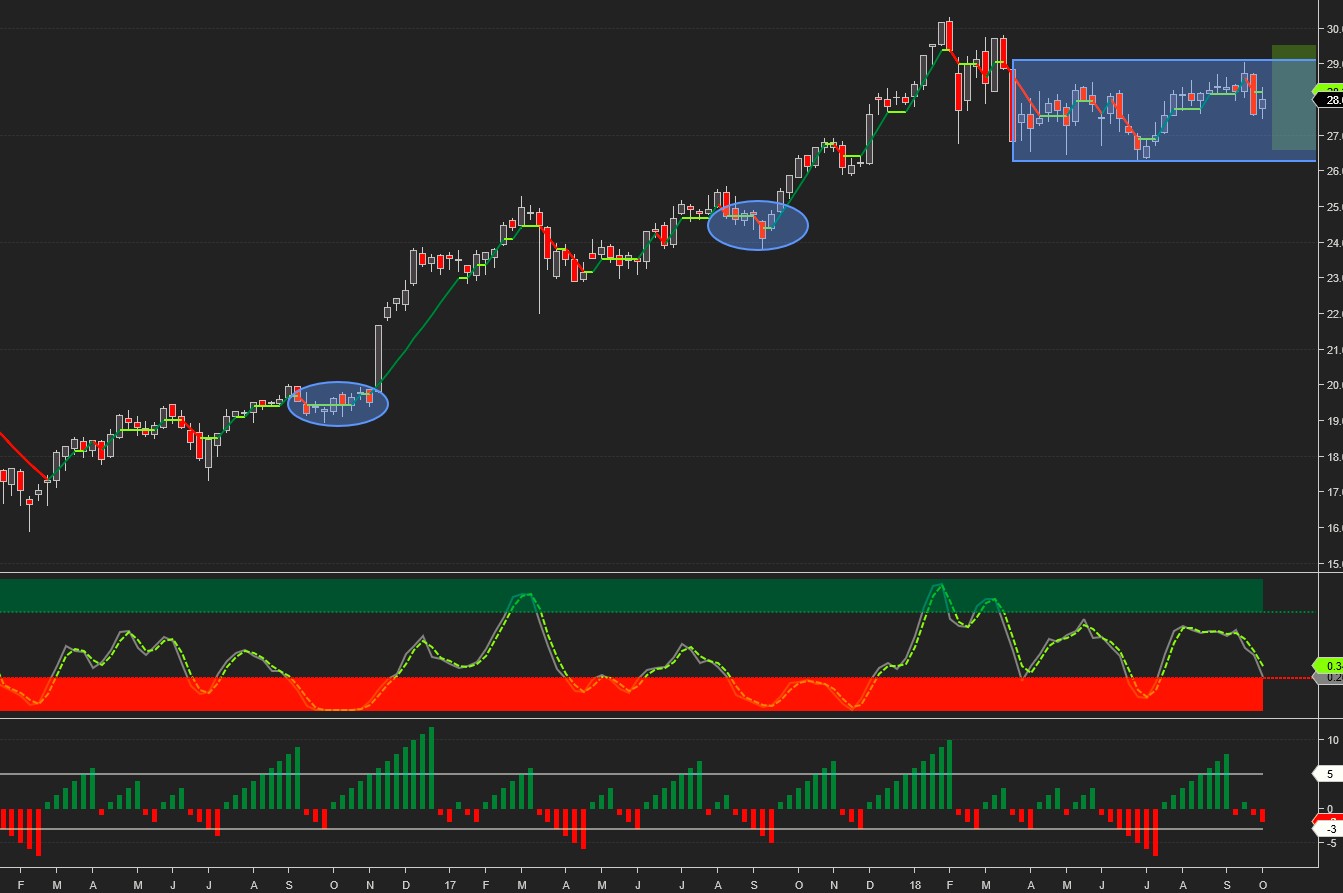
XLK is trending higher, making higher highs and higher lows:
XLV remains in an uptrend but seems over-extended both time and momentum wise. It shouldn’t come as a surprise to see rotation out of XLV to some of the weaker sectors:

XLY was in a strong uptrend until last week, but was most affected by the sell-off. As long as it trades above the January high at 109, however, the technical outlook will remain bullish:
In summary, of the 5 sectors leading previous SPX downturns, two are flat and three remain in an uptrend. Of the rest, XLE made a new high in May and is in a short-term uptrend, XLI is trending up and closing in on the January high, XLP has been trading flat since August, while XLU registered the largest gain for the week. Therefore, although the picture is somewhat mixed, the overall sector technical outlook for the time being remains positive.
Charts, signals and data courtesy of OddsTrader, CIT for TradingView and NinjaTrader 8
Disclaimer:Futures and forex trading contains substantial risk and is not for every investor. An investor could potentially lose all or more than the initial investment. Risk capital is money that ...
more

