
S&P 500, Dow Jones Price Outlook: Traders Clamor For Exposure In ETFs
The S&P 500 and Dow Jones trade narrowly beneath their all-time highs after bulls mounted a concerted effort to press higher throughout the week. While bouts of risk appetite were common in August, few saw a convincing rotation out of haven assets like gold and Treasuries. Likewise, the VIX remained elevated suggesting traders had lingering doubts on the strength of each attempted rebound.
However, as I highlighted in my Dow Jones September forecast, the exodus of summer-trading conditions will look to bring volume and volatility back into equity markets. The fresh trading landscape will likely allow for greater conviction behind price moves which have already been witnessed in the S&P 500, Dow Jones and Nasdaq. Alongside their breakouts, the major Indices saw their respective exchange-traded funds notch notable inflows.
(Click on image to enlarge)
Source: Bloomberg
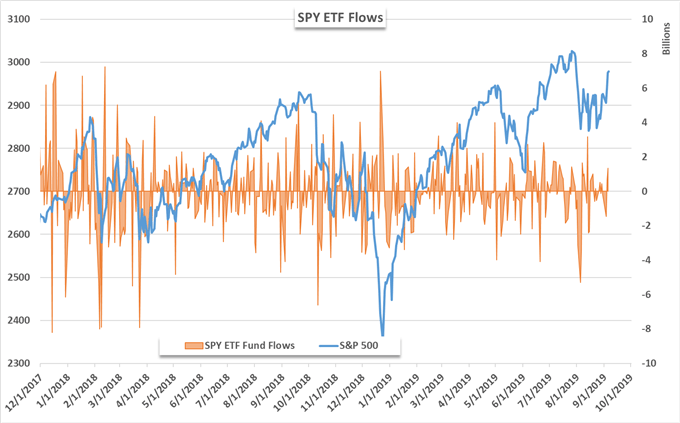
After a month of whipsaw, it is too early to definitively highlight a trend in the various fund flows but in the pursuit of a bullish continuation, the initial signs are encouraging. Thursday trading saw the SPY ETF register its largest inflow since August 13 at $1.35 billion. Interestingly, the SPY fund saw a modest net outflow of just -$400 million in August, despite the widespread risk aversion across various assets throughout the month. Given the monthly return of -1.8%, it would not be entirely surprising to see a greater outflow – especially considering the massive demand for gold and silver ETFs.
(Click on image to enlarge)
Source: Bloomberg
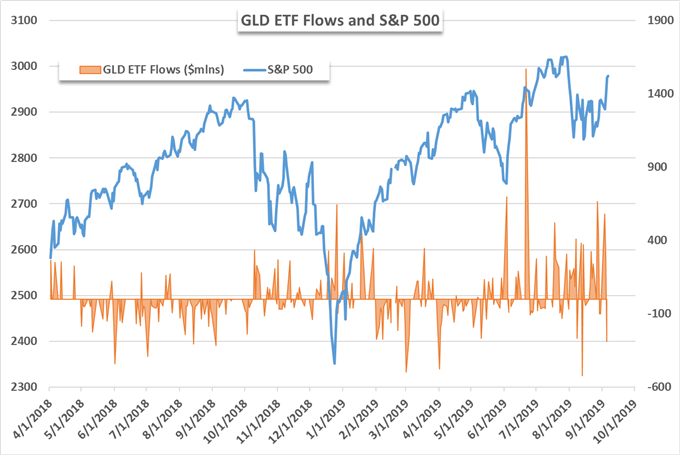
To that end, the gold-tracking GLD ETF still maintains positive fund flows in the first week of September and in the latter half of August - regardless of the concurrent deterioration in gold spot prices this week. Although demand for safety in gold lingers, optimism for the future can be found elsewhere, namely in the HYG and JNK funds.
(Click on image to enlarge)
Source: Bloomberg
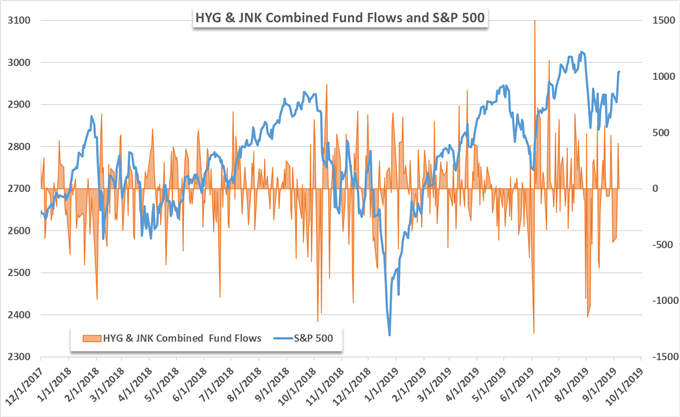
Together, the two junk-bond-funds have started to right the ship. After a cumulative outflow of -$2.6 billion in the first half of August, HYG and JNK registered net inflows of roughly $750 million in the latter half and are roughly deadlocked in September thus far. Therefore, assuming the fundamental landscape remains somewhat consistent, recent price action and fund flows suggest risk aversion is firmly on the backfoot.
Thus, the technical breakouts witnessed on the S&P 500, Dow Jones and Nasdaq charts could signal the advent of a concerted effort higher – but traders should keep a close eye on gold and the VIX. Until capital allocation to gold begins to slow or reverse, it suggests some investors are unconvinced the rebound has legs.


