
Shorter-Term Trends And Longer-Term Outlook For Saturday, Oct. 26
The Short-Term Trend
The short-term uptrend continues. A week ago, it looked like the market was getting ready to move lower again in the short-term. But the market started to pick up strength mid-week and finished with a bullish Friday.
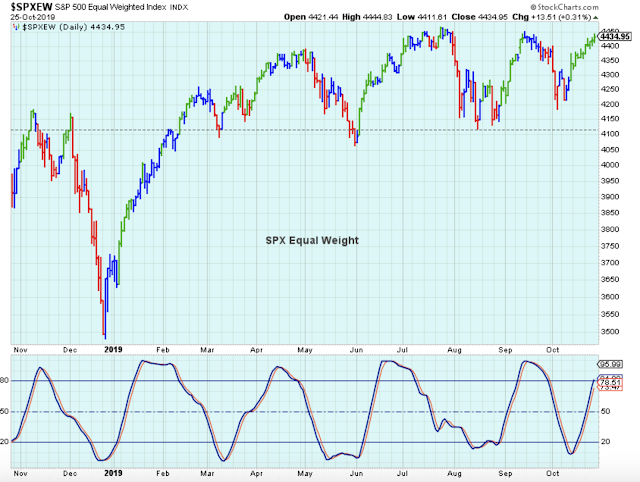
Here is a one year view of the SPX equal weight and it shows that the market has been experiencing very distinct short-term price-momentum cycles. If the trend holds then based on this chart we might get another few weeks of strength before the next pullback.
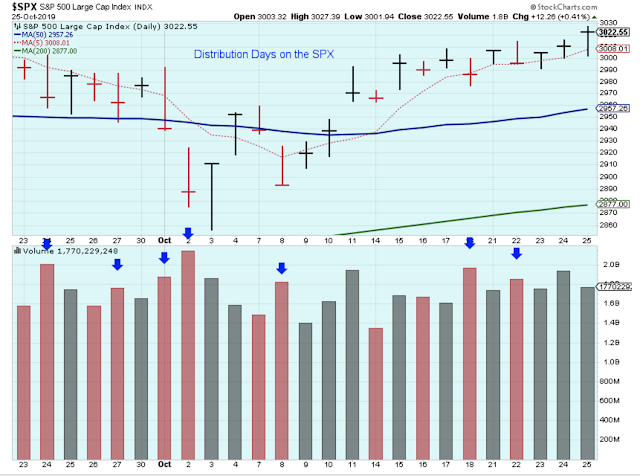
I've been trying to do a better job of incorporating volume into my Technical bag of tricks, so I have been tracking volume using the IBD method of counting distribution days. This chart below shows quite a few distribution days over the past five weeks. It obviously means that caution is called for in this market, but it always feels that way to me. Also, the market was strong on Friday but declined in volume from Thursday which is a negative.
Friday's rise in prices on lower volume is consistent with this chart below that shows the 10-day Call/Put declining, and this is another market negative.

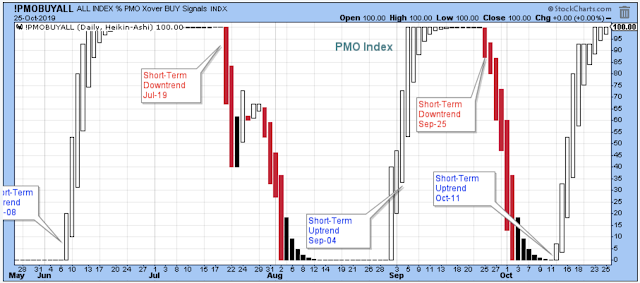
What to think about this market short-term?It seems like we have more of the same from this market in the weeks ahead. A few more days or weeks of the current short-term rally that inches us up slightly higher, followed by a short-term decline that scares us but then bottoms out slightly above the previous cycle low. The bottoming of the market then sets us up for the next short-term rally.
If we play it right by trimming holdings at the peak and then adding to holdings at the low, and if we are in the stocks and sectors showing relative strength, then we'll make money. But making money this way means we have to stick to the trading plan. No freaking out. We just follow the indicators.
The Long-Term Outlook
There is a rally taking place in many of the foreign markets despite all the bad headline news. The Nikkei has rallied past a buy point towards a 52-week high. Bullish.

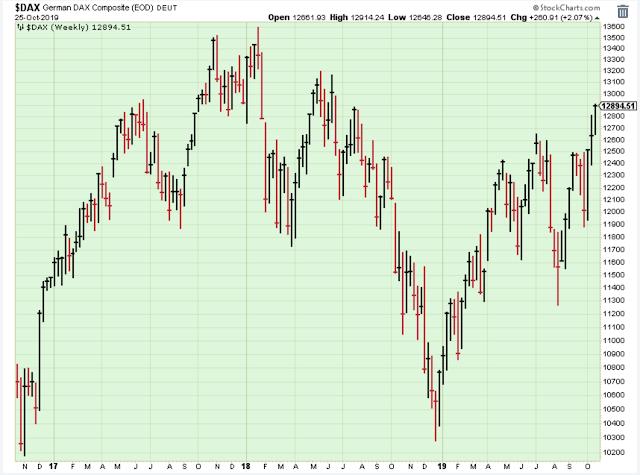
A similar rally is taking place for the German DAX. This chart has the look of an inverted head-and-shoulders. Bullish.
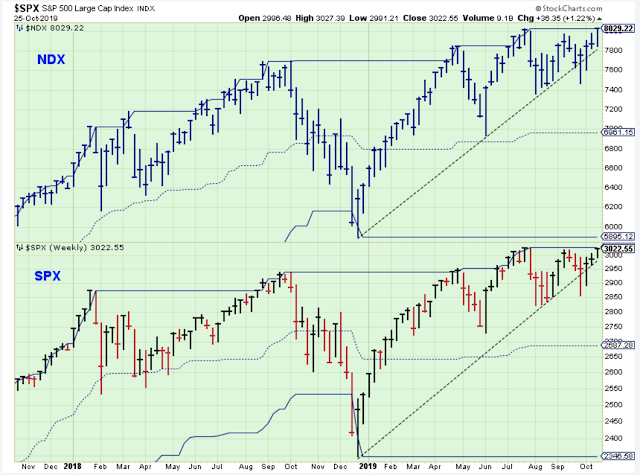
Here is a chart of the US market and it looks very good to me. The two most important indexes are leading stocks into new highs after a scary whipsaw break down in September. Bullish.
Semiconductors are leading the way higher per usual. This chart looks so good.
Momentum stocks (growth stocks) are still lagging, but they really don't look that bad if you go by this MTUM ETF shown below.

When the growth stocks turned lower in September my outlook on the market went from negative to very negative. How could I possibly be optimistic about stocks if all the stocks in my accounts were heading lower?
However, I have lost enough money based on my emotions to teach me not to follow my emotions. So I followed my trading plan and trimmed and pruned the former leaders and moved money into the current leaders, and now I am back in sync with the market, I hope.
Everyone was calling it a rotation into value. My pessimistic view was that the economy was teetering on the edge and money managers were getting out of the way by moving into stocks that would not go down in price by as much as growth stocks.
But it could also have been that the economy was bottoming out and finally starting to benefit by lower rates and the increase in the money supply. Somehow, money managers with their magic powers were able to sniff out this turn in the economy, and so they moved into the stocks that were going to benefit the most from economic growth... the value stocks.
But who cares. We aren't here to be right, we are here to make money. So I am currently holding the stocks that are hitting new highs, but I also have my eye on my favorite former leaders because if the economy is going to start growing again then the former leaders are going to have a comeback.
I don't usually mention individual stocks because I don't have any special insight into companies. I just know what I read online and that is available to everyone.
But I mention these two companies because they are among the best of the growth stocks based on their charts. They show the rapid run-up in price, and then the sell-off that started Sep-09. When you step back and look at this chart, they definitely needed to take a break and consolidate.
Just within this past week, Mastercard (MA) touched the low of its range looking like it could break down, but ended the week near the high of the range and looking like it could break above a buy point. At the moment, both stocks (including V) look like they could be building a new bullish base.

Disclaimer: I am not a registered investment advisor. My comments above reflect my view of the market, and what I am doing with my accounts. The analysis is not a recommendation to buy, ...
more

