
Safest ETF Dividend Yields
In today’s market environment, cash is king. Only firms with strong core earnings [1] and cash flows will be able to sustain their dividends. Accordingly, only ETFs that hold stocks with these safe dividends will be able to maintain their own dividends. Earlier this week, we featured the Riskiest ETF Dividend Yields. Safer ETF dividend yields are this week’s Long Idea.
Our Robo-Analyst [2] identifies ETFs with high dividend yields and holdings with the cash flows to sustain the dividends. These ETFs are in a better position to maintain dividends in the future, even as economic conditions deteriorate.
Not All Dividend Yields Are Created Equal
Many ETFs have high dividend yields. However, many firms are likely to cut dividends in an effort to conserve cash to weather the recent economic disruption brought on by the COVID-19 pandemic. Investors need to analyze the sustainability of the dividend yields of an ETF’s holdings to find ETFs that can sustain their dividend payments. ETFs whose holdings generate the free cash flow (FCF) needed to pay their promised dividends are much safer than ETFs whose underlying holdings don’t.
In other words, the more an ETF invests in stocks with safe dividend yields, the safer the ETF’s own dividend yield becomes. Investors should focus on the core earnings and free cash flow of ETF holdings to assess the quality of ETF dividend yields.
Here are the criteria we used to identify the ETFs with the safest dividend yields:
- A surplus of FCF over dividend payments over the past five years as a percent of enterprise value (FCF Surplus as % of Enterprise Value)
- Dividend yield greater than 3%
- A positive FCF yield over the trailing twelve month (TTM) period
- A Neutral-or-better Risk/Reward rating
Figure 1 shows the FCF surplus as a percent of enterprise value, dividend yield, and FCF yield of the ten ETF’s under coverage with the highest FCF surplus as a percent of enterprise value that meet the above criteria.
Figure 1: Top 10 Safest ETF Dividend Yields
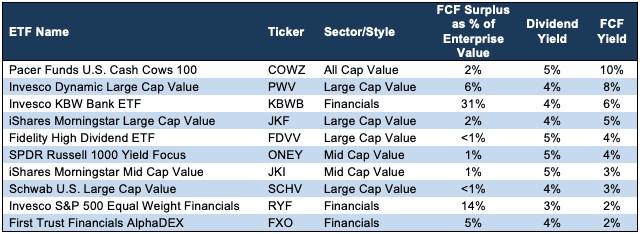
Sources: New Constructs, LLC and company filings.
Each of the ETFs in Figure 1 has a positive FCF yield and a surplus of FCF minus dividends over the past five years (5yr FCF surplus). The three ETFs in Figure 1 with the highest FCF surplus as percent of enterprise value belong to the Financials sector.
We recently featured 30 of the safest dividend yield stocks under coverage. 29 of those stocks are held by the ETFs in Figure 1. The holdings in each of these ETFs have generated, on aggregate, more in FCF than they have paid out in dividends over the past five years. In a slowing or contracting economy, we think firms with a history of strong cash flow generation, and the ETFs that hold them, are in a safer position to maintain their dividends.
Below, we’ll examine two of the safest dividend yield ETFs in more detail.
A Safe ETF Dividend Yield: Invesco KBW Bank ETF – 4% dividend yield
Invesco KBW Bank ETF (KBWB) provides one of the safest ETF dividend yields. KBWB has a current dividend yield of 4%, and an even higher FCF yield of 6%.
By taking a closer look at each holding, we find that 17 of KBWB’s 24 holdings – or 71% – have a 5yr FCF surplus. For comparison, 59% of State Street Financial Select Sector SPDR’s (XLF) holdings and just 54% of the S&P 500’s (SPY) holdings have a 5yr FCF surplus.
Figure 2 compares KBWB against the sector benchmark, XLF and SPY. Not only does KBWB have a higher dividend yield, it also has a greater 5yr FCF surplus as a percent of enterprise value and FCF yield. With so many of its holdings paying dividends from a strong cash position, KBWB’s dividend is more secure than an ETF with holdings that have weaker cash flows.
Figure 2: A Safe Dividend Yield: KBWB vs Benchmarks

Sources: New Constructs, LLC
A KBWB Holding with a Safe Dividend: Citigroup Inc. (C) – 5% dividend yield
Citigroup Inc. (C) is one of KBWB’s safe dividend holdings. Citigroup’s fundamentals, along with its cheap valuation, earn it our Attractive Risk/Reward rating. While there are stocks with higher dividend yields, the firm’s ability to generate cash flow is what makes its dividend yield much safer than others.
Profitability on the Rise
C’s fundamentals and profitability have been trending up recently, which increases the sustainability of its dividend payment. C’s net operating profit after-tax (NOPAT) margin rose from 17% in 2018 to 20% in 2019. C’s invested capital turns, a measure of capital efficiency, increased from 0.29 to 0.31 over the same time. The combination of rising margin and capital turns drove C’s return on invested capital (ROIC) from 5% in 2018 to 6% in 2019.
Generating Cash in Recent Years
Citigroup has generated positive free cash flow in each of the past five years and generated a cumulative $147 billion in FCF since 2015. However, the firm has paid out only $18 billion in dividends over the same time. Figure 4 plots the $129 billion surplus between free cash flow and dividends paid since 2015. C’s current FCF yield of 21% is well above the 4% average of Financials sector firms, and further illustrates the firm’s cash generation.
Figure 3: C’s FCF Vs. Dividends Since 2015
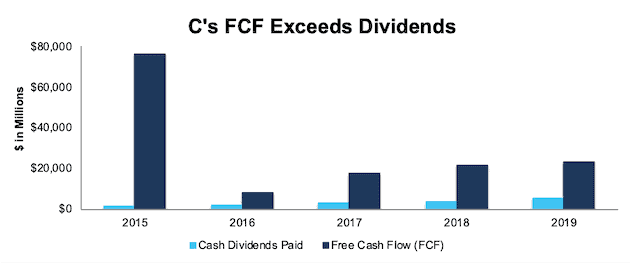
Sources: New Constructs, LLC and company filings
With its strong profitability and history of cash flow generation, it should be no surprise that Citigroup recently confirmed it was maintaining its dividend.
Another Safe ETF Dividend Yield: Pacer Funds U.S. Cash Cows 100 (COWZ) – 5% dividend yield
We originally made Pacer Funds U.S. Cash Cows 100 (COWZ) a Long Idea in March 2019. At that time, we noted that COWZ uses FCF, FCF yield, and enterprise value to find high-quality stocks. With such a focus on cash flows, it’s no surprise that COWZ is again a Long Idea this week.
COWZ has a current dividend yield of 5%, which looks sustainable when we take a closer look at its holdings. 69 of COWZ’s 98 holdings – or 70% – have a 5yr FCF surplus. For reference, 51% of iShares U.S. Value ETF’s (IUSV) holdings and 54% SPY’s holdings have a 5yr FCF surplus. Companies that are able to generate significant amounts of cash flow are more capable of maintaining their dividends even during bad economic times.
Figure 4 compares COWZ against the style benchmark, IUSV and overall market, SPY. Not only is COWZ’s dividend yield significantly higher, so too is the 5yr surplus between FCF and dividend payments as a percent of enterprise value. COWZ’s 5yr FCF surplus and high FCF yield make its dividends safer than other ETFs.
Figure 4: Another Safe Dividend Yield: COWZ vs Benchmarks

Sources: New Constructs, LLC
A COWZ Holding with a Safe Dividend: NetApp Inc. (NTAP) – 5% dividend yield
NetApp Inc. (NTAP) was another stock featured in our Safest Dividend Yields report and is one of COWZ’s quality holdings. While NetApp’s 5% dividend yield may not draw as much attention as some stocks with higher yields, a deeper look reveals this yield is safer than most.
Rising Profitability in Recent Years
NTAP’s profitability has trended upward in recent years and the firm has generated ample cash flows to cover its dividends. NTAP’s NOPAT margin increased from 5% in 2016 to 14% TTM. NTAP’s invested capital turns actually fell from 3.8 to 3.0 over the same time. However, the improved NOPAT margin was enough to offset the capital efficiency decline, and NTAP’s ROIC improved from an already high 20% in 2016 to 41% TTM.
A Cash Generating Business
NTAP has generated positive free cash flow in nine of the past 10 years and generated $2.7 billion from 2015 to 2019. NTAP’s TTM FCF is also $797 million. Meanwhile, the firm paid out just $1.2 billion in dividends from 2015 to 2019. Figure 5 plots the $1.4 billion surplus between free cash flow and dividends paid from 2015 to 2019.
Figure 5: NTAP’s FCF vs. Dividends Since 2015
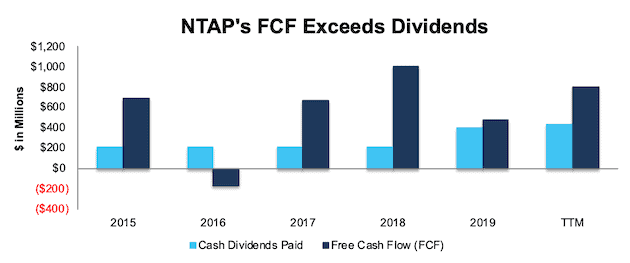
Sources: New Constructs, LLC and company filings
NTAP’s current FCF yield of 10% is well above the Technology sector average of 2%, and highlights NTAP’s significant cash generation.
The firm’s consistent profitability and cash flow generation make its dividend safer than most in these difficult times.
[1] Our core earnings are a superior measure of profits, as demonstrated in In Core Earnings: New Data & Evidence a paper by professors at Harvard Business School (HBS) & MIT Sloan. The paper empirically shows that our data is superior to IBES “Street Earnings”, owned by Blackstone (BX) and Thomson Reuters (TRI), and “Income Before Special Items” from Compustat, owned by S&P Global (SPGI).
[2] Harvard Business School features the powerful impact of our research automation technology in the case New Constructs: Disrupting Fundamental Analysis with Robo-Analysts.
Disclosure: Get the best fundamental research. Disclosure: David Trainer, Kyle Guske II, and Matt Shuler receive no ...
more

