
Russell 2000: Signaling Next Stock Market Flush
The Russell 2000 continues to be the best leading indicator any investor can follow for overall market moves. To give an example, the S&P was at all-time highs in February 2020, the Russell 2000 was not, in fact, it was struggling. This is what is called a negative divergence and was a leading indicator for the stock market flush that followed in March 2020.
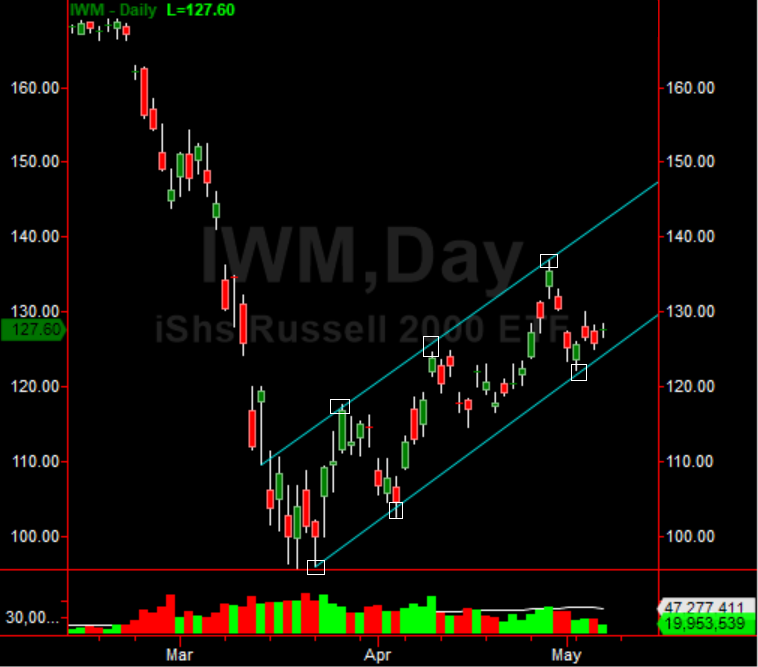
Using this thesis, investors should be watching a channel on the Russell 2000 chart for the next stock market flush. Since the March 2020 lows, the Russell 2000 (ETF IWM) has been grinding higher, always staying in the channel. Should the Russell 2000 break below the channel, the stock market will likely collapse within days. As long as the Russell 2000 stays within the channel, stocks are likely safe from another epic stock market collapse. Take note of the chart below.
(Click on image to enlarge)
Disclosure: None.


