
Rating Breakdown: Best & Worst ETFs & Mutual Funds By Style
This report identifies the best ETFs and mutual funds based on the quality of their holdings and their costs. As detailed in “Low-Cost Funds Dupe Investors”, there are few funds that have both good holdings and low costs. While there are lots of cheap funds, there are very few with high-quality holdings.
Without speculating on the cause for this disconnect, I think it is fair to say that there is a severe lack of quality research into the holdings of mutual funds and ETFs. There should not be such a large gap between the quality of research on stocks and funds, which are simply groups of stocks.
After all, investors should care more about the quality of a fund’s holdings than its costs because the quality of a fund’s holdings is the single most important factor in determining its future performance.
My Predictive Rating system rates 7400+ mutual funds and ETFs according to the quality of their holdings (portfolio management rating) and their costs (total annual costs rating).
The following is a summary of my top picks and pans for all style ETFs and mutual funds. I will follow this summary with a detailed report on each style, just as I did for each sector.
Figure 1 shows the best ETF or mutual fund in each investment style as of April 10, 2014. Investors should focus on All Cap Blend, All Cap Value, All Cap Growth, Large Cap Value, and Large Cap Blend funds as only those styles contain Attractive funds.
For a full list of all ETFs and mutual funds for each investment style ranked from best to worst, see our free ETF and mutual fund screener. For more products, click here.
Figure 1: Best ETFs and Mutual Funds In Each Style
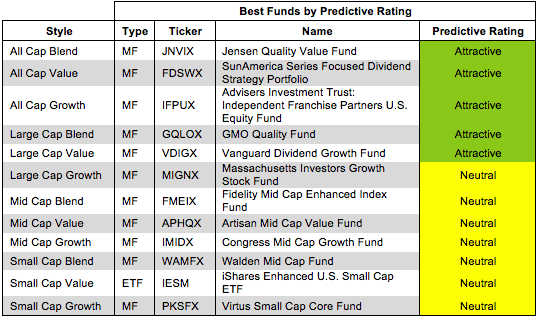
Source: New Constructs, LLC and company filings
Sun America Focused Dividend Strategy Portfolio (FDSWX) is my top rated All Cap Value fund and the number one rated mutual fund out of all style ETFs and mutual funds I cover. FTCS allocates over 52% of its assets to Attractive-or-better rated stocks, and its total annual costs are 1.09%.
Eli Lilly and Co. (LLY) is one of my favorite stocks held by FDSWX and earns my Very Attractive rating. At 8% compounded annually over the past 9 years, LLY’s profit (NOPAT) growth won’t turn any heads, but its consistency is respectable. The company generates a return on invested capital (ROIC) of 17%, a number that puts LLY in the top quintile of all companies I cover. In addition, LLY has generated positive economic earnings every year since 1998. One might expect a company such as LLY to command a high valuation, but that’s not the case here. The stock has yet to recover from weaker-than-usual earnings in 2012, despite strong profit growth in 2013. At its current valuation of ~$60/share, LLY has a price to economic book value (PEBV) ratio of 0.9. This ratio implies that the market expects LLY’s NOPAT to drop by 10% and never rise again. This combination of solid growth and a cheap valuation makes LLY a Very Attractive stock, and FDSWX’s almost 4% allocation to LLY and other good equities help give the fund its Attractive rating.
Figure 2 shows the worst ETF or mutual fund for each investment style as of April 10, 2014. Every style has Very Dangerous funds that can hurt investors.
Dangerous-or-worse-rated funds have a combination of low-quality portfolios (i.e. they hold too many Dangerous-or-worse rated stocks) and high costs (they charge investors too much for the [lack of] management they provide).
Figure 2: Worst ETFs and Mutual Funds In Each Style
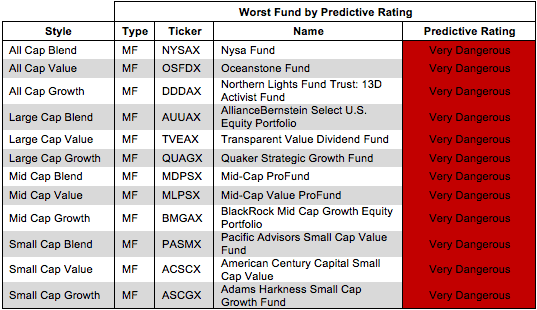
Source: New Constructs, LLC and company filings
Nysa Fund (NYSAX) is my worst-rated All Cap Blend fund and worst rated fund out of all the style ETFs and mutual funds I cover. It earns my Very Dangerous rating. NYSAX allocates only 2% of its assets to Attractive-or-better rated stock while charging investors total annual costs of 8.79%, the second highest costs of any style fund. There are thousands of other funds out there with even marginally better portfolios that will charge investors less for their investment.
DryShips (DRYS) is one of my least favorite stocks held my MDPSX and earns my Dangerous rating. Since 2008, its after-tax profit (NOPAT) has declined at a rate of 18% compounded annually. The company’s return on invested capital (ROIC) also sits at just over 2%, a number that puts DRYS in the bottom quintile of all companies I cover. DRYS has generated increasingly negative economic earnings every year since 2009. Still, for such a struggling company, DRYS is highly overpriced. The shipping company’s already low valuation of ~$3/share implies that DRYS will grow NOPAT by 20% compounded annually for 12 years. Considering the company’s inablity to grow NOPAT for more than two consecutive years since its IPO, these expecations seem too optimistic. It would be difficult to justify a serious investment in DRYS, and the fact that DRYS is NYSAX’s top holding should give investors pause before putting money into this fund.
Traditional mutual fund research has focused on past performance and low management costs. The quality of a fund’s holdings has been ignored. Our portfolio management rating examines the fund’s holdings in detail and takes into account the fund’s allocation to cash. Our models are created with data from over 70,000 annual reports. This kind of diligence is necessary for understanding just what you are buying when you invest in a mutual fund or an ETF.
Figure 3 shows the best fund based on our Portfolio Management Rating for each investment style as of April 10, 2014. Investors should look to All Cap Blend, All Cap Value, All Cap Growth, Large Cap Blend, and Large Cap Value for funds with the best portfolios.
Attractive-or-better-rated funds own high-quality stocks and hold very little of the fund’s assets in cash – investors looking to hold cash can do so themselves without paying management fees. Only 0.1% of funds receive our Attractive or Very Attractive ratings, so investors need to be cautious when selecting a mutual fund or ETF – there are thousands of Neutral-or-worse-rated funds.
Figure 3: Style Funds With Highest Quality Holdings
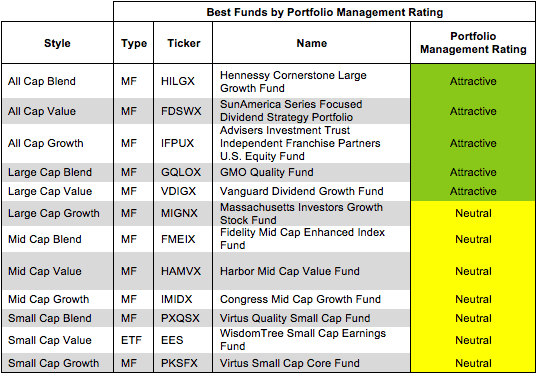
Source: New Constructs, LLC and company filings
Figure 4 shows the worst fund based on our Portfolio Management Rating for each investment style as of April 10, 2014.
Investors pay mutual fund managers to pick stocks for them. Even ignoring costs, these mutual fund managers do a poor job investing money for their clients.
Figure 4: Style Funds With Lowest Quality Holdings

Source: New Constructs, LLC and company filings
Investors should care about all of the fees associated with a fund in addition to the quality of the fund’s holdings. The best funds have both low costs and quality holdings – and there are plenty of low cost funds available to investors.
Figure 5 shows the best fund in each investment style according to our total annual costs rating. An ETF ranks as the lowest cost for six of the twelve style categories.
Total Annual Costs incorporates all expenses, loads, fees, and transaction costs into a single value that is comparable across all funds. Passively managed ETFs and index mutual funds are generally the cheapest funds.
Figure 5: Style Funds With Lowest Costs
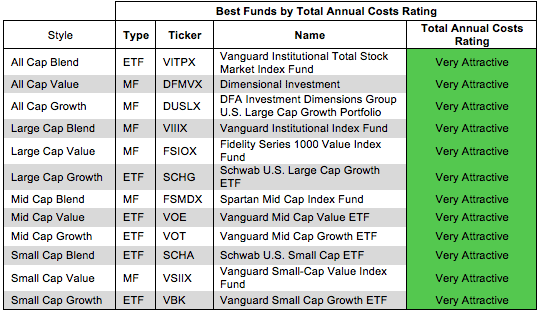
Source: New Constructs, LLC and company filings
The most expensive fund for each investment style has a Very Dangerous total annual costs rating. Investors should avoid these funds and other funds with a Very Dangerous total annual costs ratings because they charge investors too much. For every fund with a Very Dangerous total annual costs rating, there is an alternative fund that offers similar exposure and holdings at a lower cost. We cover over 7000 mutual funds and over 400 ETFs. Investors have plenty of alternatives to these overpriced funds.
Figure 6 shows the worst fund in each investment style according to our total annual costs rating. No ETFs ranks as the most expensive for any style category.
Figure 6: Style Funds With Highest Costs
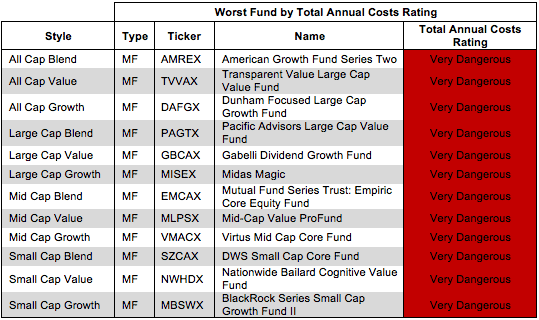
Source: New Constructs, LLC and company filings
David Trainer and André Rouillard receive no compensation to write about any specific stock, sector, or theme.


