
Quick Pull Back Should Reset Bullish Cycle
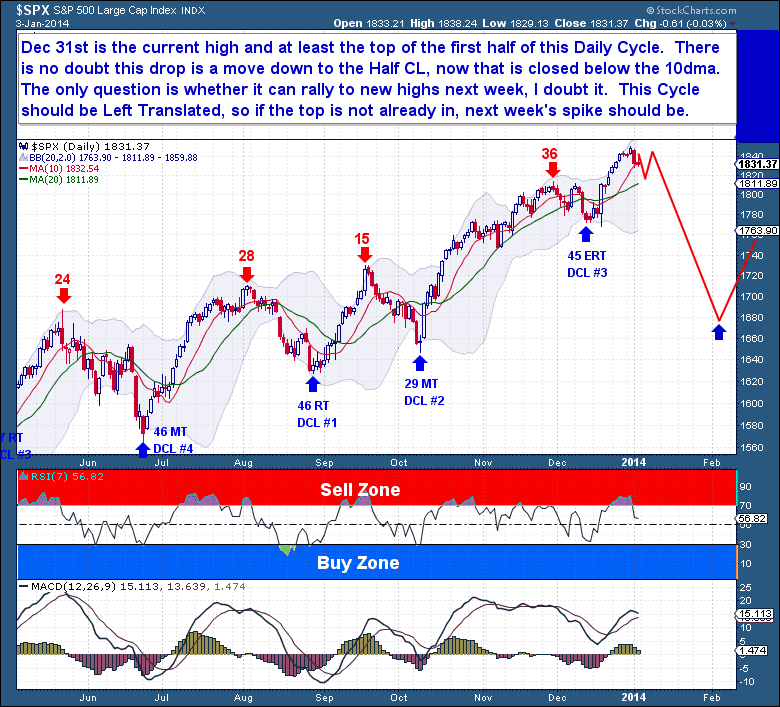
As regards my primary equity Cycle expectations, price and time have pretty much hit my targets. We have a day 12 high set on Dec 31st, one to two days earlier than my expected Left Translated top. If this isn’t the major top I’ve been anticipating, then it’s at least a Half Cycle Top…and we can expect a fall into a HCL followed by another burst to a final top before price rolls over and begins Investor and Yearly Cycle declines.
There is little doubt the current drop is at least a move down into the HCL. This was confirmed on Friday, when the S&P dropped below the 10dma. The decline may well continue into Monday and Tuesday, where the 20dma should provide an immediate floor. Because the current Cycle is expected to be Left Translated, there is a great chance the Daily Cycle Top is already in and any bounce off the 20dma will fail to find new highs.
On the weekly chart, a very bullish up-trend is still in play. The only bearish aspect of the chart is how extended the current Investor and Yearly Cycles have become. Without the benefit of Cycle analysis, it would be easy to be fooled into thinking the current uptrend can continue without interruption. But very few Investor Cycles have ever gone beyond 27 weeks or 4 Daily Cycles, none since the 1982-2000 bull market. If equities are to continue higher at present, they need a significant 4-6 week retrace to form an ICL and YCL before heading up again.
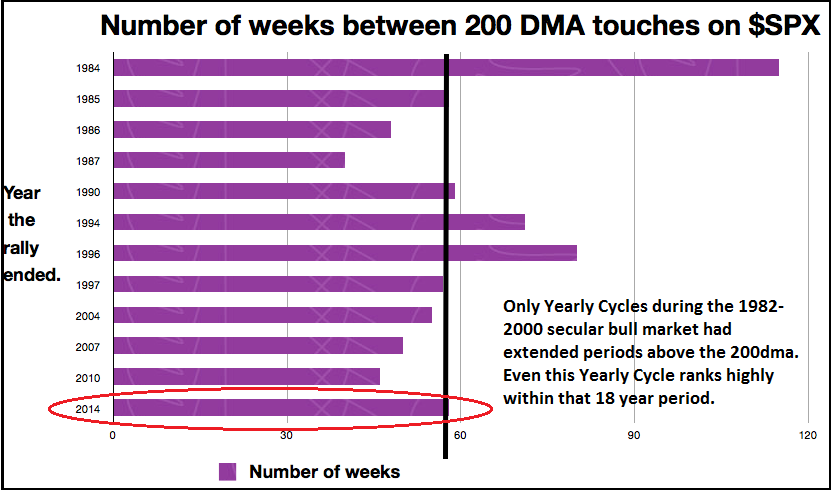
We know the current Investor Cycle is stretched – it made a new high 27 weeks after the last real Cycle Low. 27 weeks is long by historical standards, but it’s made more interesting because the current Cycle follows another long Cycle, which also topped at 27 weeks. Those two Investor Cycles together make up the current Yearly Cycle, and the YC is as overbought and extended as Cycles get. Yearly Cycle declines are typically significant events, with declines of between 7% and 15% being the norm. Yearly Cycle Lows in an uptrend always come back to touch the 200dma, and that’s the expectation for this YCL. The current Yearly Cycle is now in the top 5 in terms of time between such declines.
On the monthly chart where Yearly Cycles are clearest, it’s easy to see the 28 months since the last significant correction (-10%). The current Yearly Cycle is already into its 14th month and is desperately overextended. Even if one is long term bullish on equities, a decline of 10% or more is needed to provide the necessary fuel for the next rally.
The above is from this weekend’s premium update from the The Financial Tap, which is dedicated to helping people learn to grow into successful investors by providing cycle research on multiple markets delivered twice weekly. Now offering monthly & quarterly subscriptions with 30 day refund. Promo code ZEN saves 10%.
None


