
Preliminary Findings Show Investors Injected A Net $454 Billion Into U.S. Mutual Funds, ETFs In Q1

A third round of stimulus payments, improving COVID-19 vaccine distributions, and talks of a $2.3 trillion infrastructure package pushed the broad-market indices to their fourth consecutive month of plus-side performance. The average equity fund (including ETFs) experienced a 6.31% return for Q1 2021 and a whopping one-year return of 61.39%.
Despite ongoing inflationary concerns, which drove the 10-year Treasury yield up 81 basis points during the first quarter to 1.74%—its highest closing value since January 23, 2020—and President Joe Biden’s plan to raise taxes on corporations and wealthy individuals, investors injected $454 billion into mutual funds and ETFs during Q1, using preliminary numbers.
Fearing an overheated market, a recent rise in coronavirus cases globally, and an increase in market volatility, money market funds (+$185.8 billion) were the main attractor of investors’ assets for the quarter. Nonetheless, investors continued to pad the coffers of long-term assets as well to the tune of $268.2 billion, with taxable bond funds (including ETFs) taking in $133.8 billion, followed by equity funds (+$107.7 billion) and municipal bond funds (+$26.8 billion).
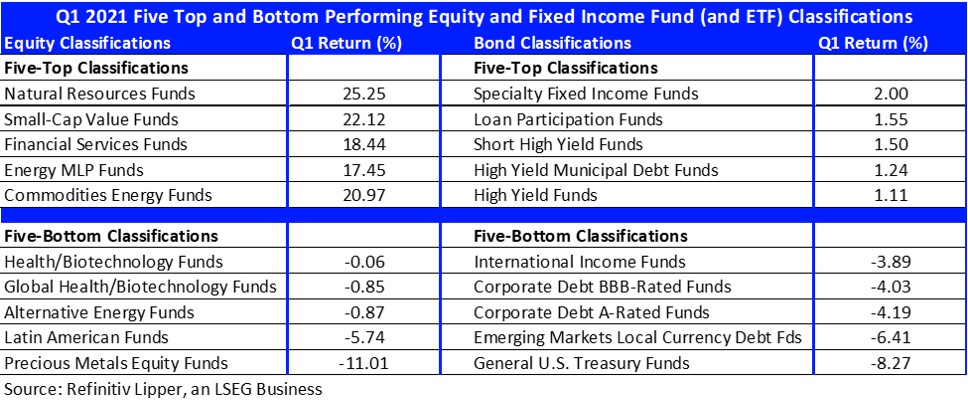
With investors rotating out of the stay-at-home and growth-oriented stocks and into cyclical issues such as financials, energy, and other previously out-of-favor sectors, it wasn’t too surprising that small-cap funds rose to the top of the inflows charts for the quarter, attracting $28.5 billion. The average Lipper Small-Cap Value Fund (+22.12%) posted the second strongest return of all equity classifications for Q1 (outpaced only by Natural Resources Funds, +25.25%).
(Click on image to enlarge)
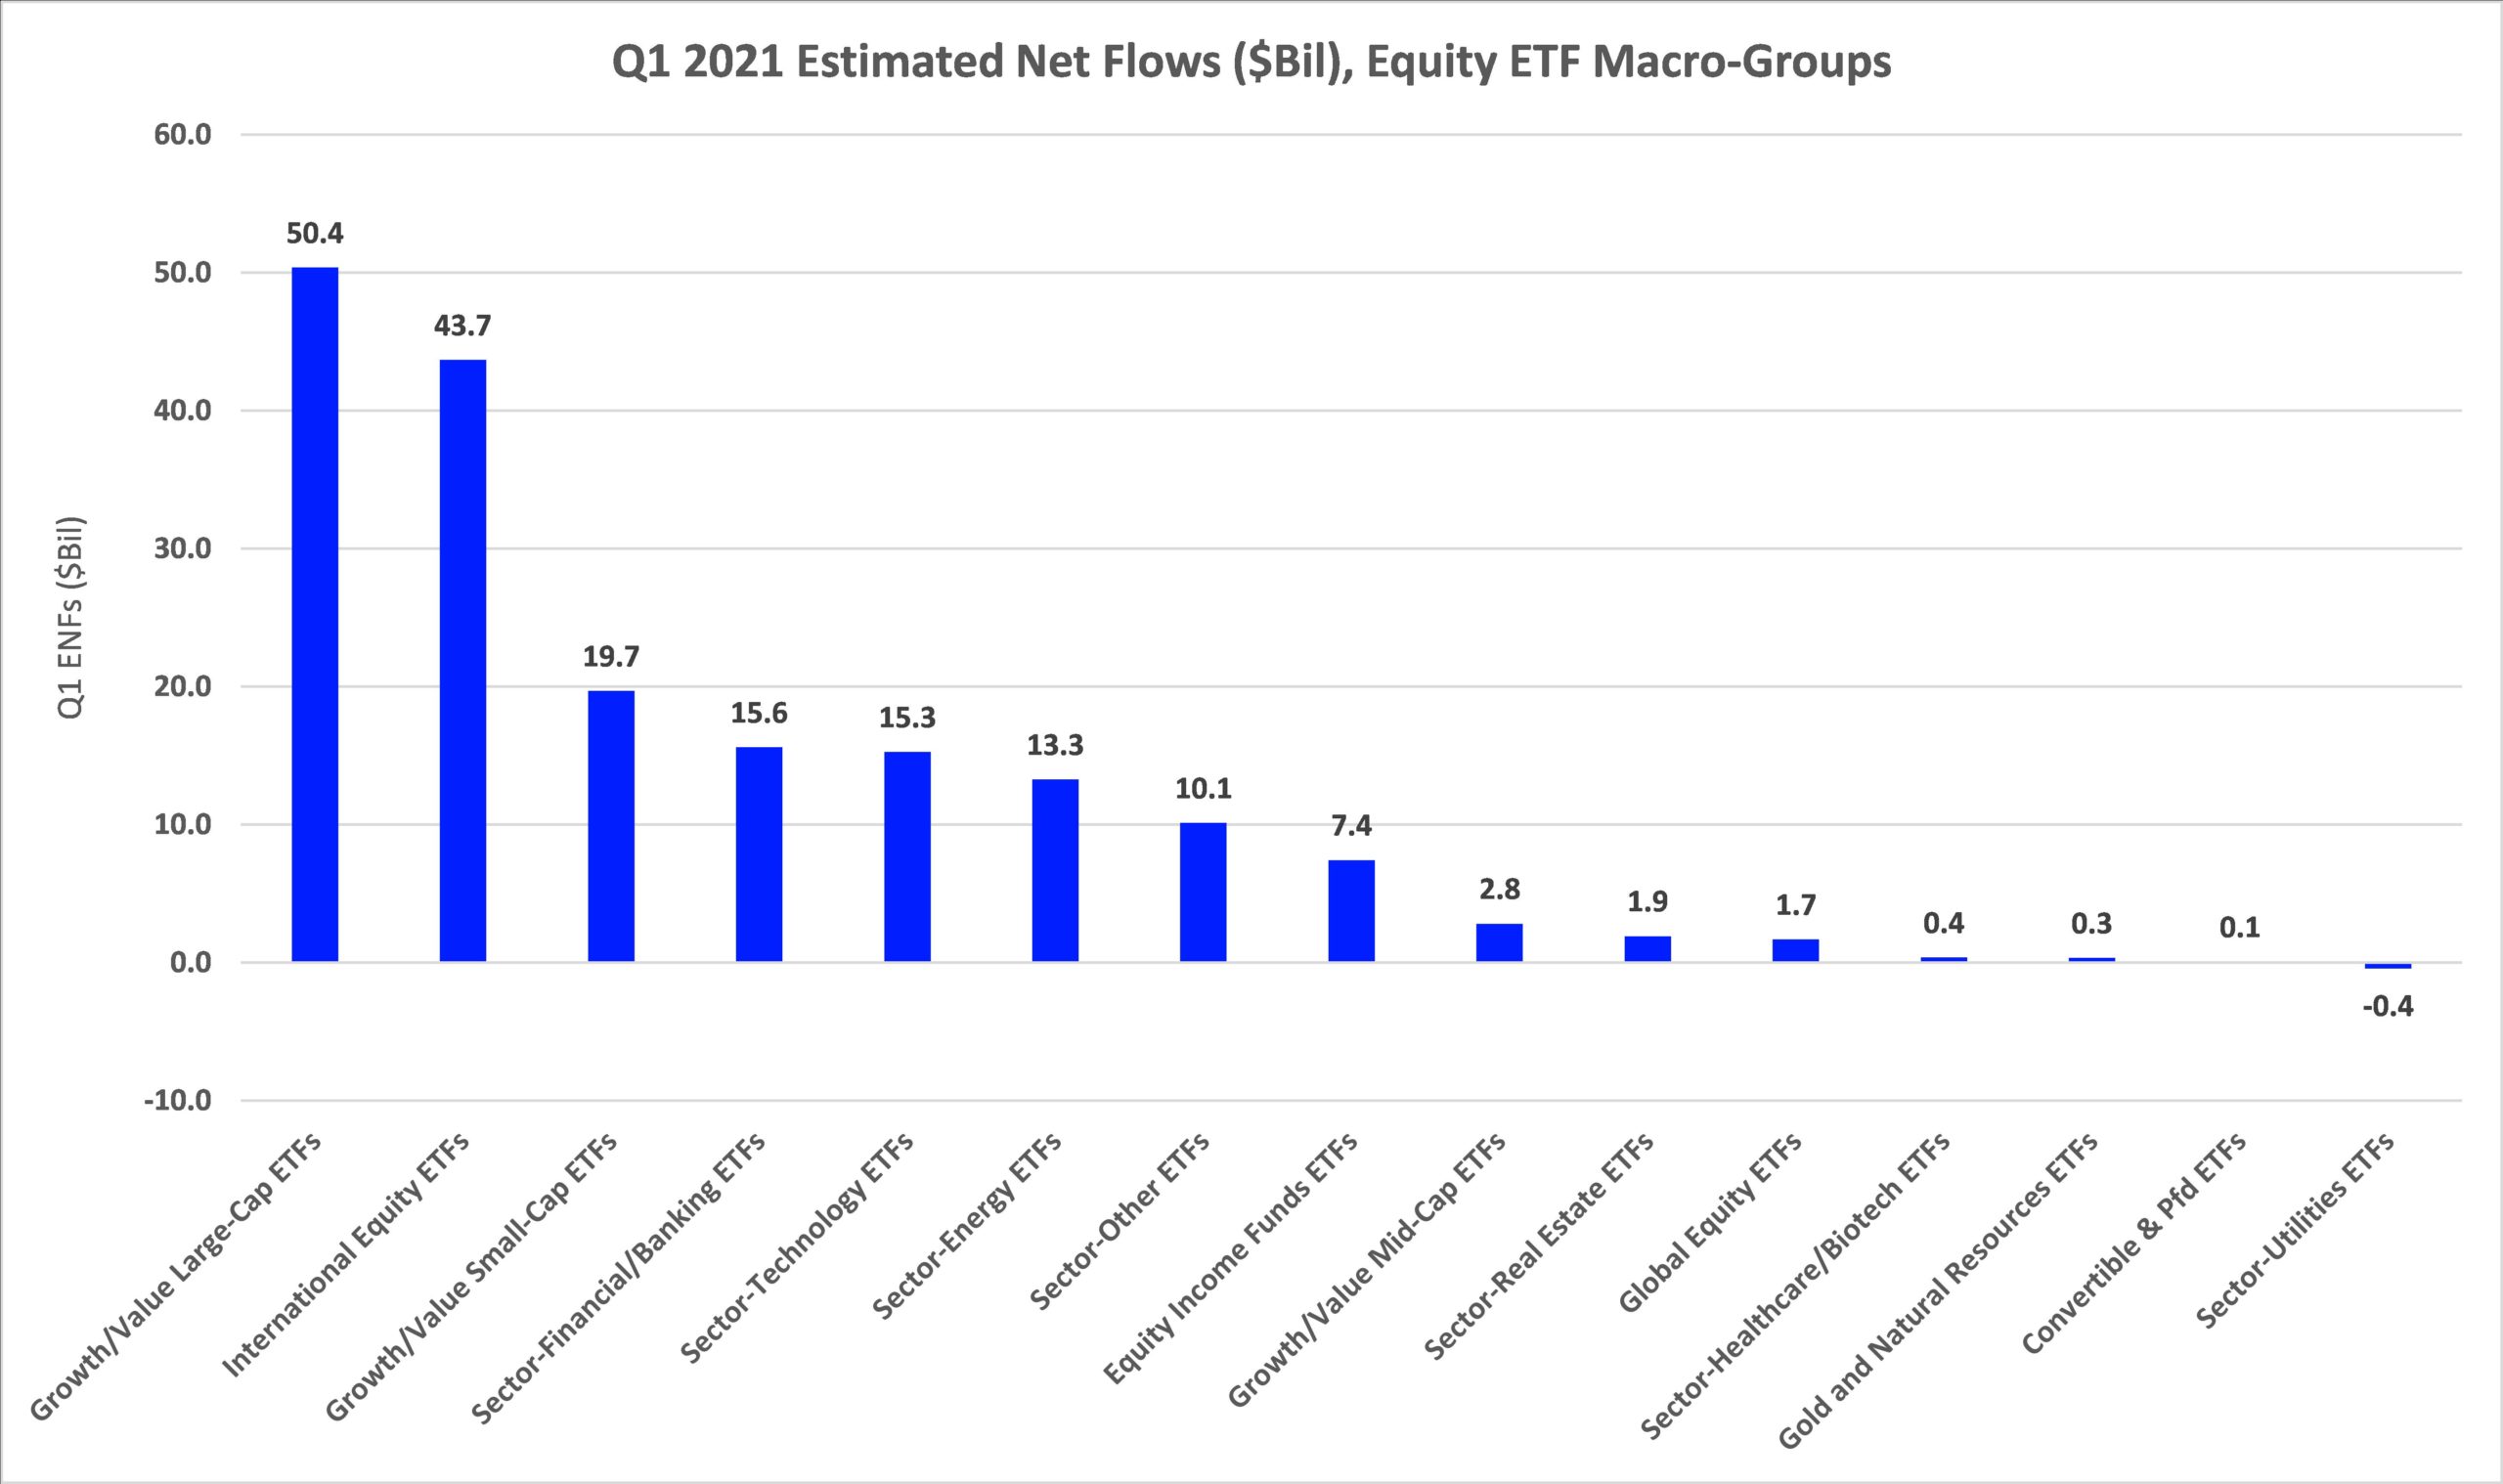
Sector-financial/banking funds (including ETFs) took the runner-up position, taking in $16.1 billion during Q1, followed by the commodities laden sector-other funds macro-group (+$15.3 billion), sector-technology funds macro-group (+$14.4 billion), and sector-energy funds (+$14.2 billion).
At the bottom of the flows chart were large-cap funds (-$2.5 billion), mid-cap funds (-$673 million), and gold and natural resources funds (-$420 million). Near-month gold futures declined 9.47% for the quarter, while oil futures rose 21.93%.
The dichotomy between conventional mutual fund and ETF flows continued during the quarter, with conventional mutual funds taking in just $46.6 billion in long-term assets, while ETFs attracted some $221.6 billion. Fund investors withdrew $74.6 billion from conventional equity funds for the quarter, while ETF investors were net purchasers of equity ETFs, injecting $182.2 billion.
(Click on image to enlarge)

And while both groups continued to be net purchasers of taxable and tax-exempt bond funds, ETF investors appeared to be a bit less sanguine in the fixed income space, injecting $34.4 billion and $4.9 billion into the respective macro-groups. Fund investors on the other hand were net purchasers of taxable bond funds (+$99.4 billion) and municipal bond funds (+$21.9 billion). Corporate investment-grade debt funds and ETFs were the main draw of net new money on the taxable bond side for both investor types, taking in $90.6 billion and $22.7 billion, respectively.
(Click on image to enlarge)
Focusing on flows into individual ETFs on the equity side, Vanguard 500 Index ETF (VOO, +$16.9 billion) took in the largest amount of net new money for the quarter, followed by Vanguard Total Stock Market Index ETF (VTI, +$9.4 billion) and Financial Select Sector SPDR Fund (XLF, +$8.6 billion). SPDR Gold Shares (GLD, -$7.5 billion) suffered the largest net redemptions of equity ETFs for Q1, bettered by iShares MSCI USA Min Vol Factor ETF (USMV, -$5.5 billion) and SPDR S&P 500 ETF Trust (SPY, -$2.9 billion).
On the ETF fixed income side, iShares Core Total USD Bond Market ETF (IUSB, +$6.4 billion) rose to the top of the flows leaderboard, followed by Vanguard Total Bond Market Index ETF (BND, +$5.6 billion), Vanguard Total International Bond Index ETF (BNDX, +$3.4 billion), and Schwab US TIPS ETF (SCHP, +$2.7 billion). At the bottom of the flows barrel, iShares iBoxx $ Inv Grade Corporate Bond ETF (LQD, -$10.5 billion) and iShares iBoxx $ High Yield Corporate Bond ETF (HYG, -$4.6 billion) suffered the largest net redemptions.
All names and marks owned by Thomson Reuters, including "Thomson", "Reuters" and the Kinesis logo are used under license from Thomson Reuters and its affiliated companies.


